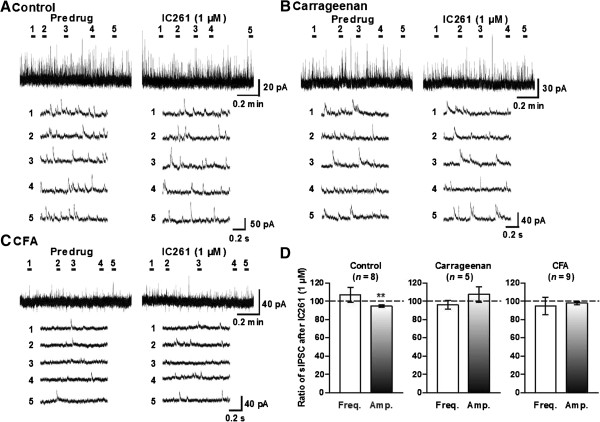
Figure 7.
IC261 had no effects on the sIPSCs in inflammatory pain model mice. Representative traces of sIPSCs in SG neurons of the spinal cord slices from naïve control (A), carrageenan (B)- and CFA (C)-inflamed mice showing the effects of 1 μM IC261. Lower five traces represent sIPSCs at five given points in time presented above the upper trace, and are shown in an expanded time scale. (D) Summary of results, testing the effects of IC261 on the mean frequencies and amplitudes of sIPSCs. The percentage compared to pre-drug response (as 100%) was shown as% control. **P < 0.01, compared with pretreatment control (Student’s t test).

