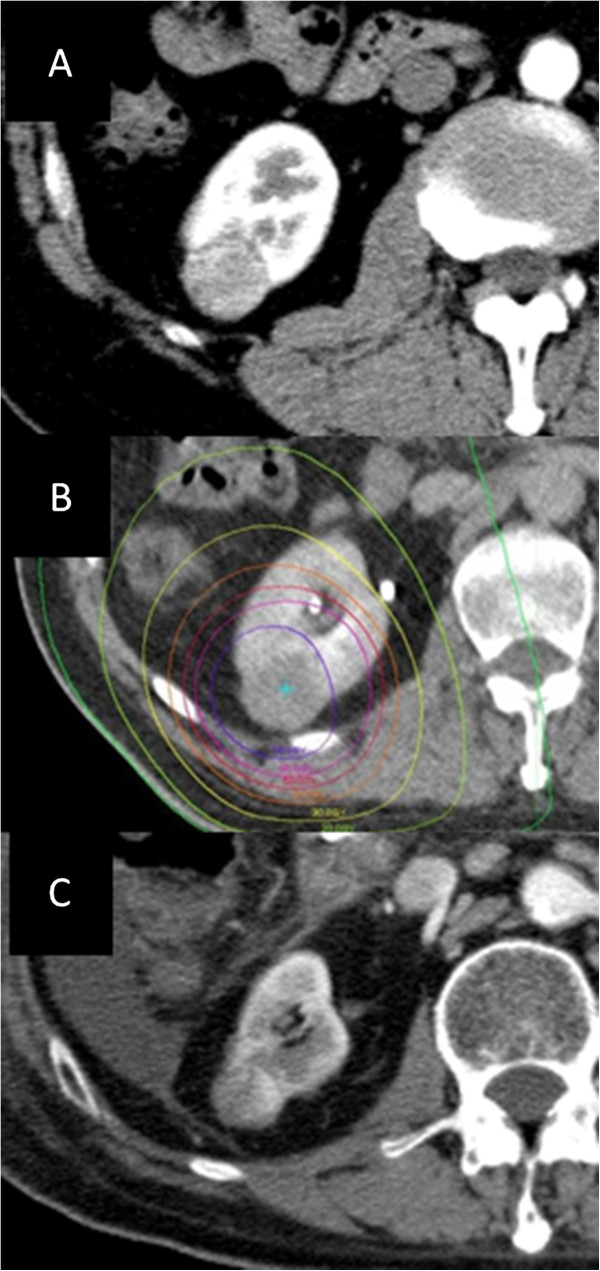
Figure 1.
Initial CT, radiotherapy planning, and follow-up CT. (A) Axial contrast-enhanced computed tomography image before stereotactic body radiation therapy. (B) Dose distribution of the planning for stereotactic body radiation therapy. Isodose lines show 70Gy, 60Gy, 50Gy, 40Gy, 30Gy, 20Gy, and 10Gy from the inside. (C) Axial contrast-enhanced computed tomography image two years after SBRT. The renal tumor decreased in size and its surrounding renal portion got atrophic.

