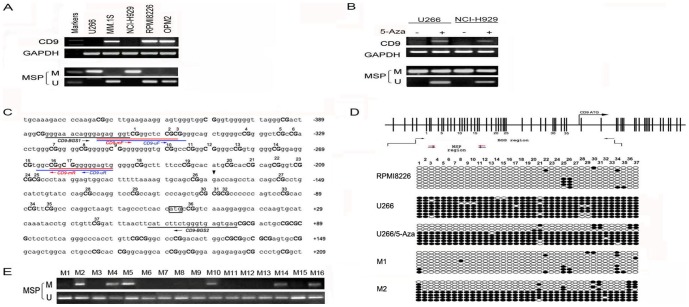
Figure 1. Analyses of methylation status of CD9 in multiple myeloma cell lines and cases.
(A) Silencing of CD9 by promoter methylation in cell lines detected by semi-quantitative RT-PCR, with GAPDH as a control. M: methylated; U: unmethylated. (B) CD9 expression reserved with de-methylation reagent 5-Aza in U266 and NCI-H929. (C) Sequence of CD9 CGI with locations of the 37 CpG sites analysed and primers used. Methylation-specific PCR (MSP) and bisulfite genomic sequencing (BGS) regions are also shown. (D) Vertical lines indicate individual CpG sites. Cloned BGS-PCR products were sequenced and each clone was shown as an individual row, representing a single allele of the CGI. Filled circle, methylated; open circle, unmethylated. (E) Analysis of CD9 methylation in primary cases by MSP. M, methylated; U, unmethylated.

