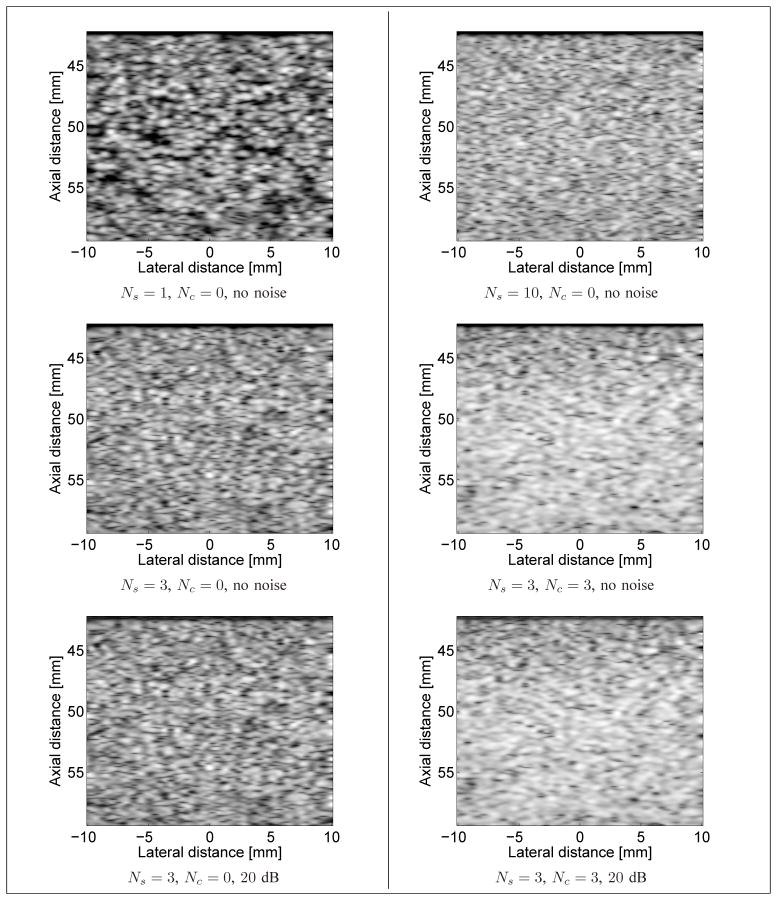
Fig. 8.
Examples of simulated B-mode images with Ns randomly located scatterers per resolution cell, Nc periodic scatterers per resolution cell, with or without noise added to the RF signal. Top left: Ns = 1, Nc = 0, no noise; Top right: Ns = 10, Nc = 0, no noise. Middle left: Ns = 3, Nc = 0, no noise; Middle right: Ns = 3, Nc = 3, no noise. Bottom left: Ns = 3, Nc = 0, RF SNR of 20 dB; Bottom right: Ns = 3, Nc = 3, RF SNR of 20 dB. A log-compression was applied to the echo envelope solely for visualization purposes.

