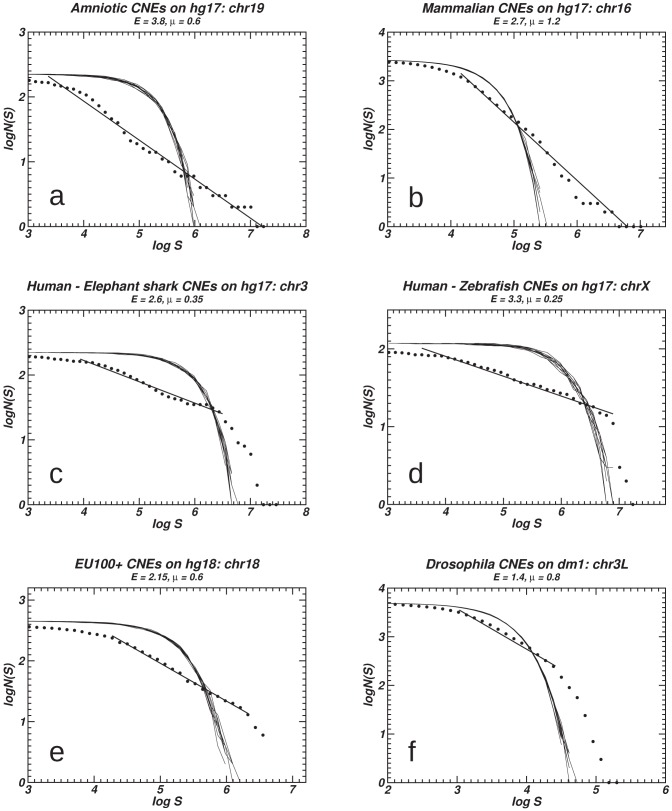
Figure 1. Examples of power-law-like size distributions.
Twelve plots of inter-CNE spacers' cumulative size distributions in whole chromosomes. Genomic curves are accompanied in each plot by 10 curves of surrogate data (continuous lines), corresponding to randomly distributed markers. The linear segments are inferred by linear regression. Whenever we mention CNEs in the plots, we refer to the distances between consecutive CNEs.

