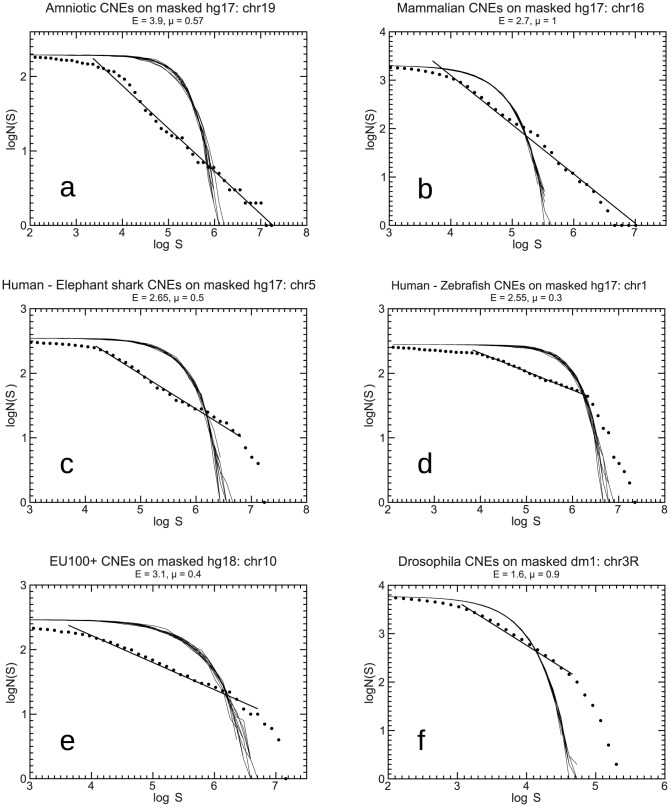
Figure 2. Examples of power-law-like size distributions after gene-masking.
Six plots of inter-CNE spacers' cumulative size distributions in whole chromosomes after masking genes and flanks (for further details see in the text). Surrogate curves and regression as in figure 1. Whenever we mention CNEs in the plots, we refer to the distances between consecutive CNEs.

