
Figure 3. Simulations using the “genomic duplications – CNE loss model”.
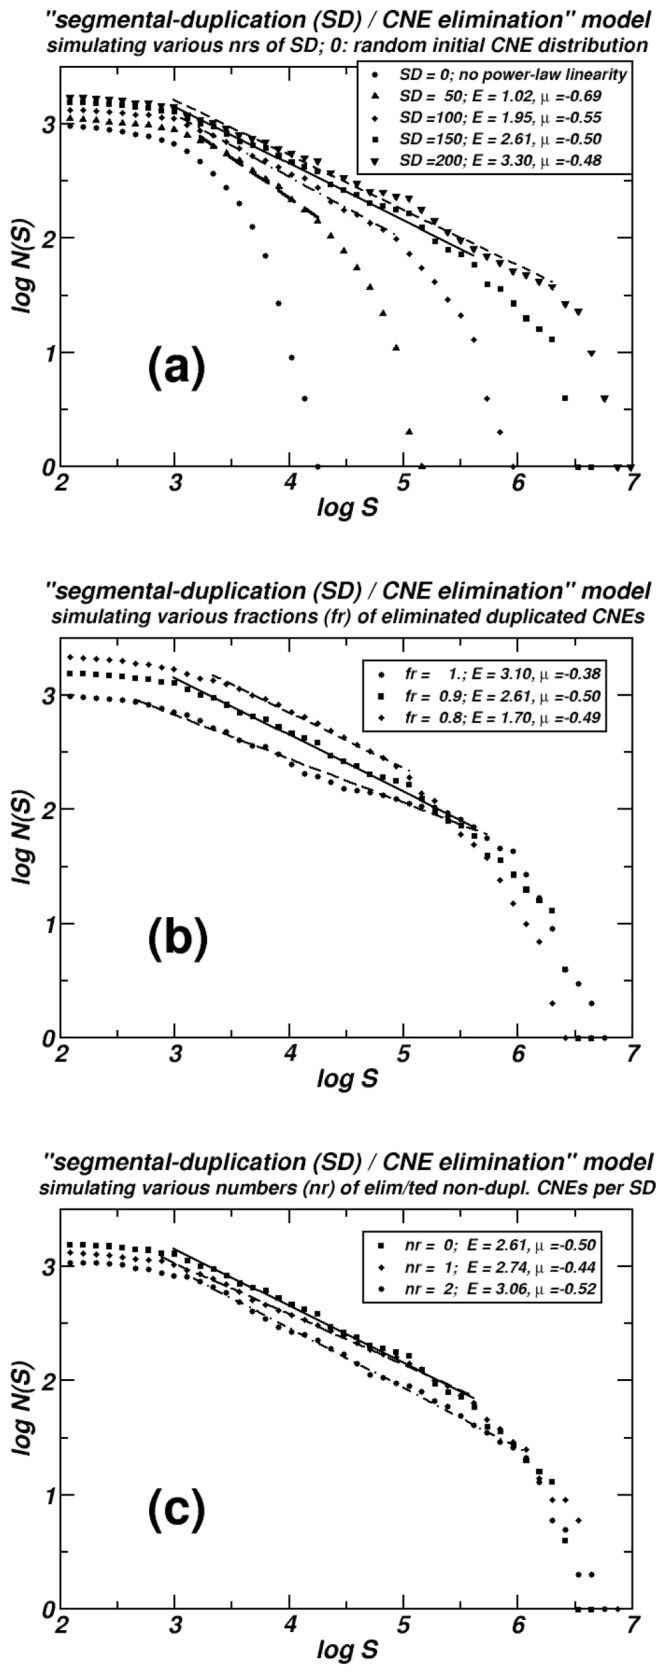
The dependence of the extent of the linearity in log-log scale for the distances between consecutive simulated CNEs on several parameters is shown: (a) The number of Segmental Duplications (SD). (b) The fraction of the duplicated CNEs eliminated after each SD (fr). (c) The number of additional, non-duplicated, CNE eliminations. In (a) we are able to follow the evolution of the emerging power-law-like pattern, as the four curves correspond to consecutive snapshots taken from the same numerical experiment. The curve depicted by squares (▪) is common in all three plots, representing a simulation including 150 segmental duplications, where 90% (fr = 0.9) of the number of duplicated CNEs are lost. No additional eliminations are supposed here. Linear segments are computed by linear regression and in all cases r2>0.98.