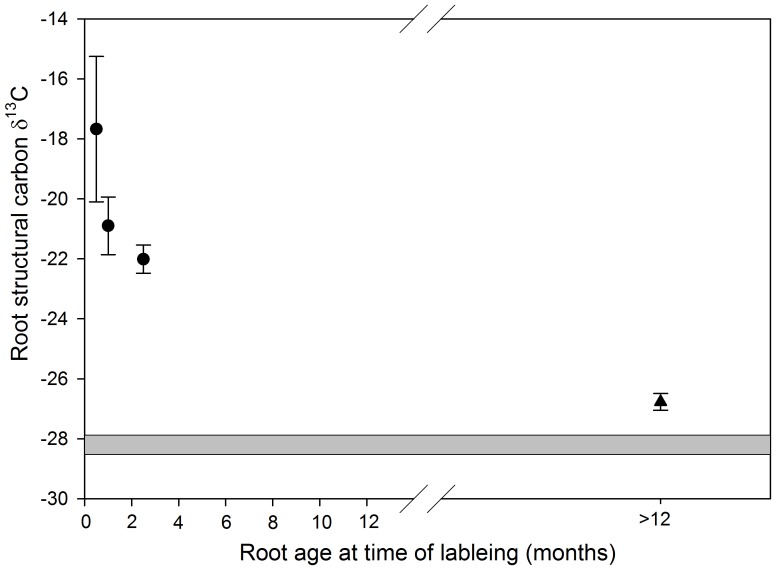
Figure 6. Mean Sassafras albidum root structural carbon δ13C values verses root age at time of sampling.
Circles represent roots sampled in 2009. The triangle represents the mean of the late wood (lw) structural root tissue from the 2008 dissection samples which were older than one year when sampled but the exact age is unknown. The grey horizontal bar shows the 95 percentiles for background δ13C structural carbon values from 2008 and 2009. Note that less negative values indicate greater isotopic enrichment. Error bars denote standard error.

