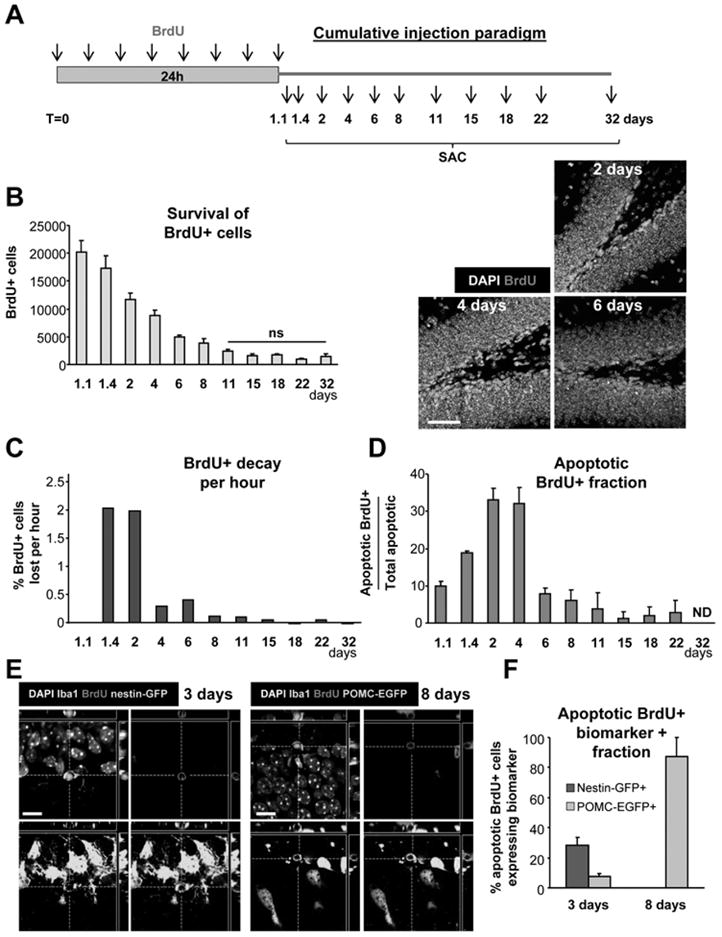
Figure 5. Survival of newborn cells in a cumulative BrdU injection paradigm.

(A) Experimental design showing the injection of BrdU every 3h for 24h and the different time points studied after the first injection (SAC = sacrifice time points).
(B) Left panel: quantification of the number of BrdU+ cells along the time course of 32 days post-injection (dpi). Statistical differences were assessed by ANOVA (p<0.001) followed by LSD tests comparing each time point with all later time points. Starting from 11dpi, no significant differences are found with any of the later time points (ns). Right panel: Photomicrographs of the 1 m.o. mouse sections of the dentate gyrus at 2, 4 and 6 dpi depict larger number of BrdU+ cells labeled with the cumulative BrdU paradigm compared to the single BrdU paradigm, but still decreasing in number over time.
(C) BrdU decay, quantified as percentage of the cells at 2 dpi lost per hour.
(D) Apoptotic BrdU+ fraction, quantified as the percentage of apoptotic cells labeled with BrdU along the time course of 32 dpi. Apoptotic BrdU+ cells peak between 2 and 4dpi.
(E) Confocal photomicrographs of the nestin-GFP and POMC-EGFP expression in the early (3dpi) and late (8dpi) critical periods, respectively.
(F) Quantification of the biomarker expression in the early (3dpi) and late (8dpi) critical periods. In the early critical period, apoptotic cells express nestin-GFP and POMC-EGFP, whereas only POMC-EGFP is expressed in the late critical period.
Scale bars: B, 50μm (z=20μm); E, 10μm. ND, non-detectable. Bars represent mean ± SEM. See also Fig. S4.
