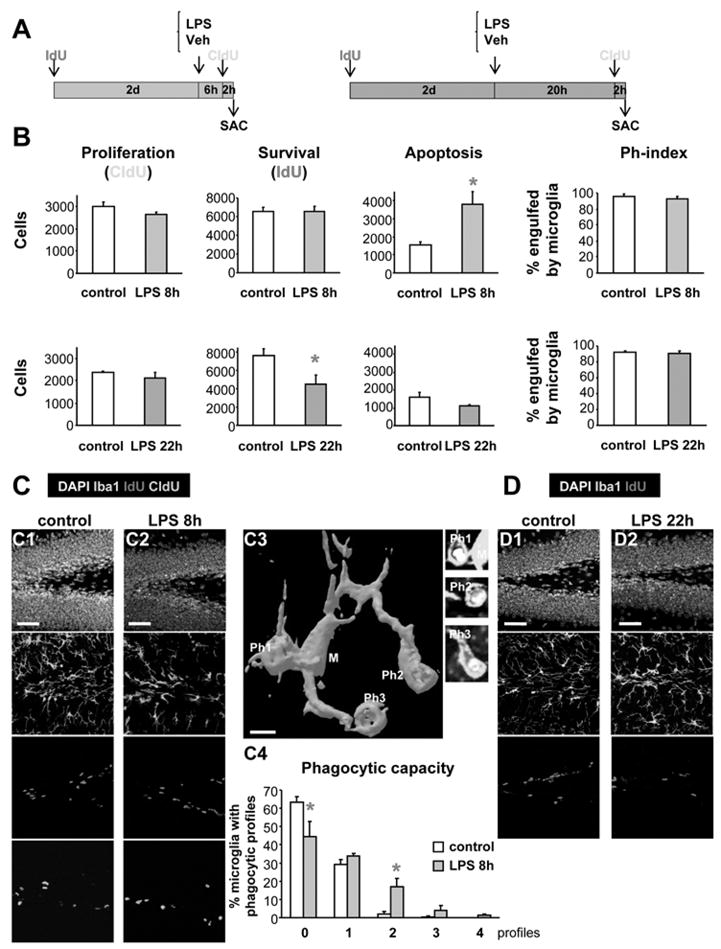
Figure 7. Acute inflammation affects young adult SGZ neurogenesis and apoptosis.

(A) Experimental paradigm for the study of the effects of LPS (1mg/kg), 8h or 22h, on the neurogenic cascade. To study the LPS effect on newborn cell survival, IdU was injected 2 days before LPS. To study the LPS effect on cell proliferation, CldU was injected 2 hr before the end of the experiment (SAC = sacrifice time points).
(B) Quantification of the effects of LPS 8h (upper panels) or 22h (lower panels) after treatment, on the NPC proliferation (CldU+ cells), newborn cell survival (IdU+ cells), apoptosis (pyknosis), and Ph-index. SGZ apoptosis increases 8h after LPS and is followed by a decreased survival 22h after LPS. Proliferation and Ph-index remain unaffected.
(C) Representative examples of the proliferation, survival, apoptosis and phagocytosis in the young adult mouse SGZ in control and LPS-treated animals at 8h (C1, C2). A 3D rendering of a microglial cell (8h after LPS) phagocytosing three apoptotic cells is shown in C3. The phagocytic capacity (percentage of microglia with 0–4 phagocytic profiles) is increased 8h after LPS treatment (C4).
(D) Representative examples of the proliferation, apoptosis and phagocytosis in the young adult mouse SGZ in control and LPS-treated animals at 22 hours (D1, D2). See also Fig. S5.
Scale bars: C1, C2, 50μm (z=20μm); C3, 5μm; D1, 2, 50μm (z=20μm). Ph1-3, phagocytic processes. Bars represent mean ± SEM.*, p<0.05 (Student t-test).
