
Figure 4. Significant effect of diagnosis-by-genotype interaction on hippocampus volume as demonstrated by voxel based morphometry analysis.
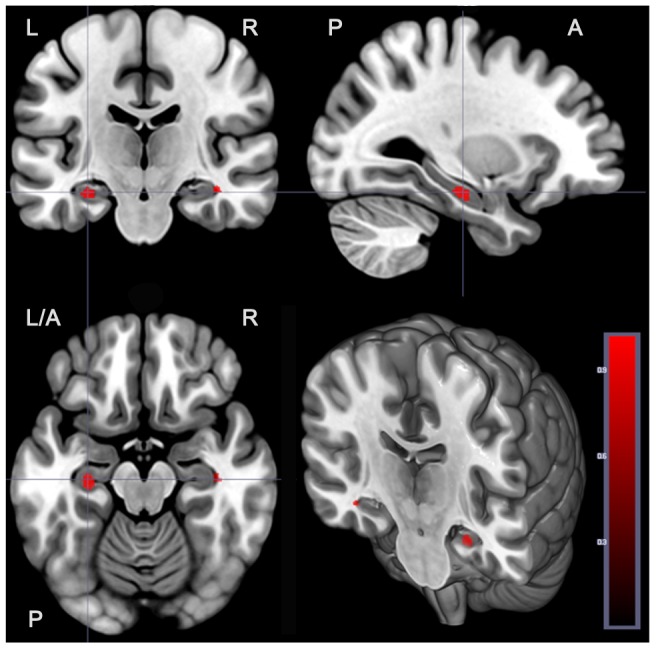
Red blobs in the figures show significant diagnosis by genotype interaction involving both right and left hippocampal volumes by VBM in parallel to those that were observed in manual analyses.