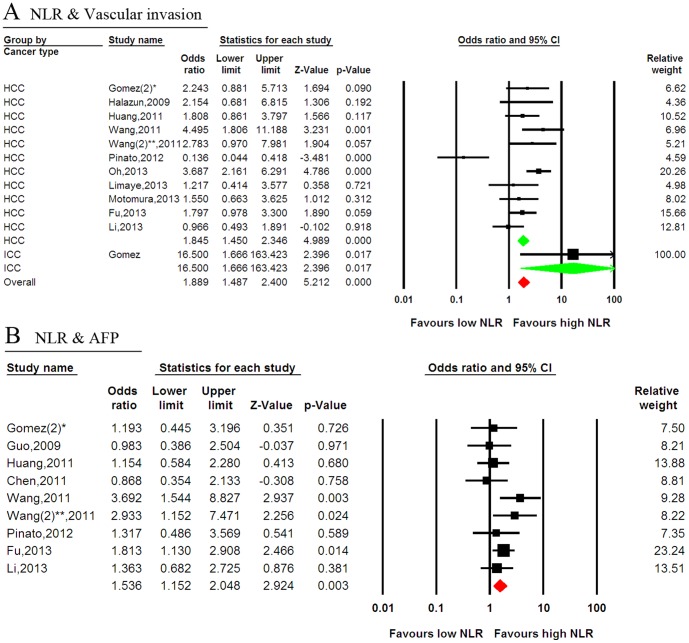
Figure 5. Forest plots of the association between the NLR and tumor characteristics.
(A) The association between the NLR and vascular invasion. (B) The association between the NLR and an elevated AFP level. Green represents the subgroup pooled effective size, whereas red represents the overall pooled effective size. NLR = neutrophil-to-lymphocyte ratio; AFP = alpha feto-protein; CI = confidence interval; *, the different study by Gomez; **, the different study by Wang.

