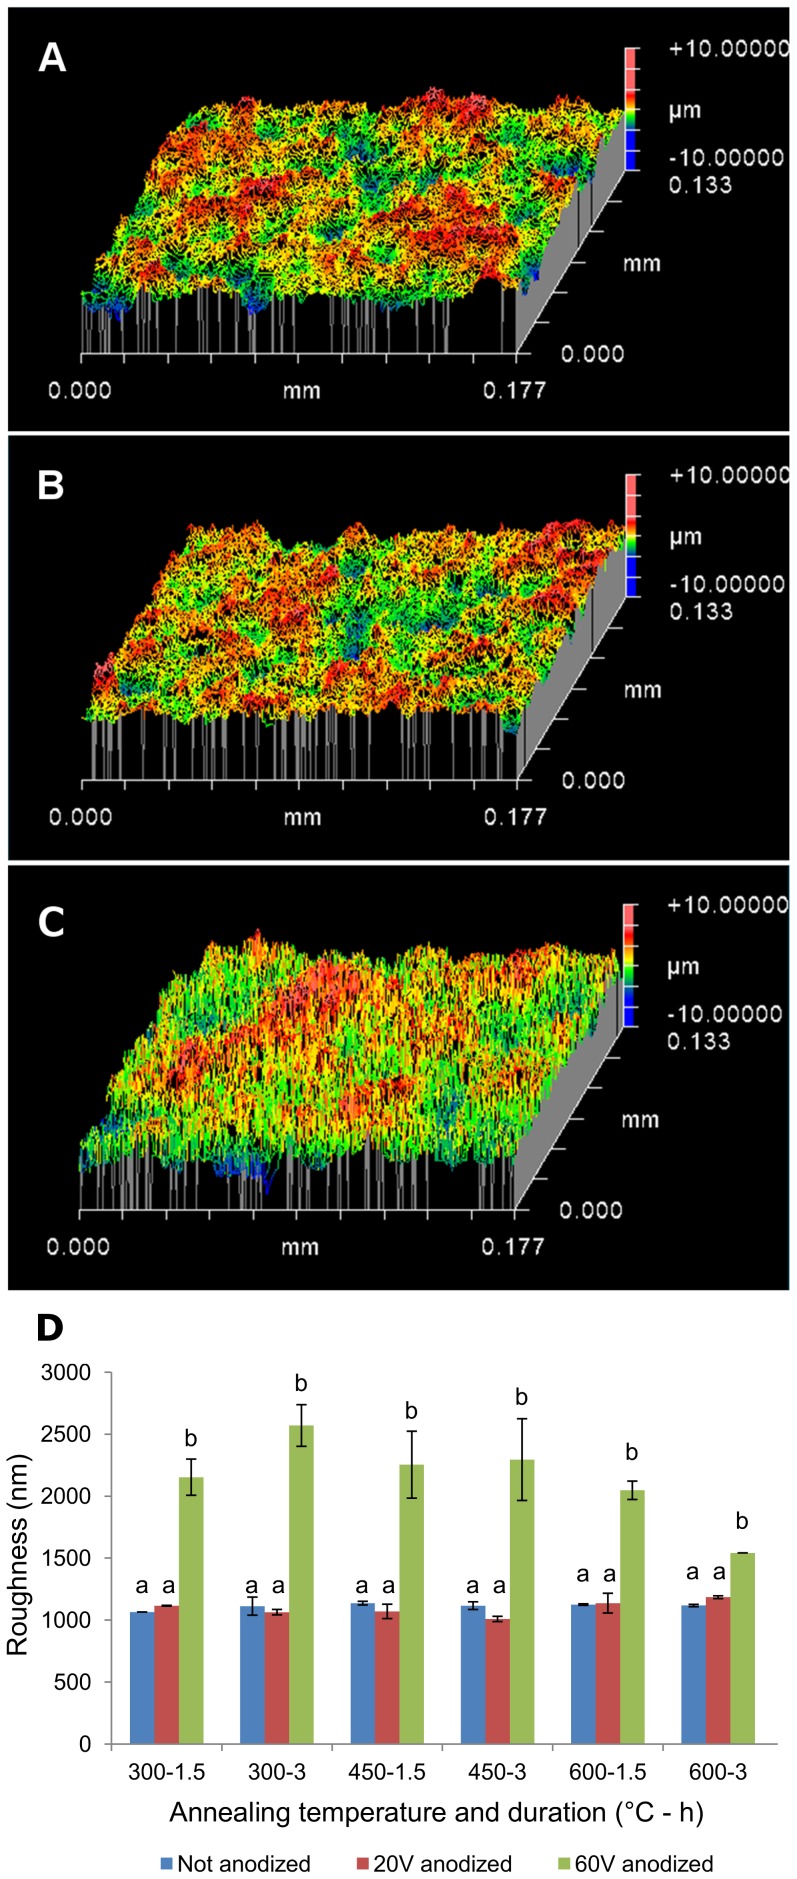
Figure 4. White light interferometry test of roughness.
Roughness test performed on (A) non-anodized sample, annealed at 450 °C for 3 h, (B) 20 V anodized sample, annealed at 450 °C for 3 h, and (C) 60 V anodized sample, annealed at 450 °C for 3 h. 60 V anodized sample show different roughness compared to 20 V anodized sample and non-anodized sample. (D) White light interferometry test indicates 60 V anodized samples possess higher average roughness and higher root mean square roughness compared with 20 V anodized samples and non-anodized samples. Average roughness is related to surface area and consequently affects surface hydrophilicity. The x-axis indicates the temperature and duration of annealing [Temp (°C) - Time (h)]. a: p<0.001compared to b. Error bars show standard deviation for n = 2 samples.

