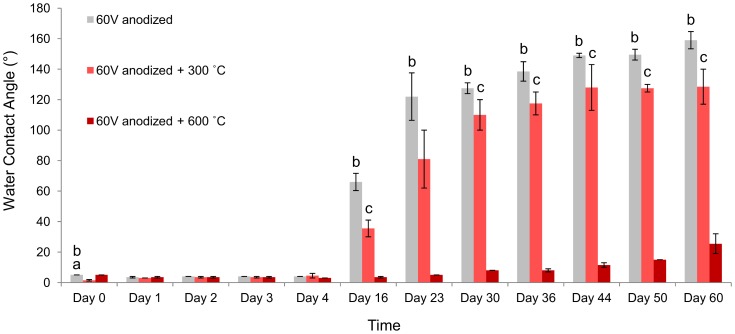
Figure 7. Effect of annealing temperature on aging behavior of 60 V anodized samples.
Gray bars are non-anodized samples, light red bars are anodized samples that are then annealed at 300 °C for 3 h (60 V+300 °C) and dark red bars are anodized samples that are then annealed at 600 °C for 3 h (60 V+600 °C). 60 V anodized samples that are then annealed at 600 °C for 3 h, are significantly more able to maintain their hydrophilicity. a: p<0.05 compared to 60 V+300 °C group, b: p<0.05 compared to 60 V+600 °C group, c: p<0.05 compared to 60 V+600 °C group. Error bars show standard deviation for n = 2 samples.

