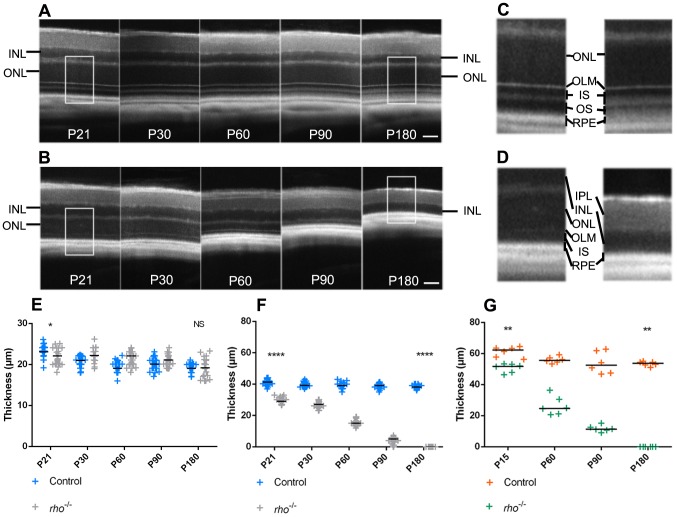
Figure 3. Characterization of a retinal degeneration mouse model by SD-OCT.
SD-OCT images of control mice retina (A) and rho−/− mice retina (B) from post-natal day 21 (P21) to 180 (P180). Magnification (X2.4) of P21 and P180 control mice outer retina (C) and rho−/− mice (D). (E) Measures of INL thickness obtained from SD-OCT data in control and rho−/− mice (P21: p = 0.0123; P180: p = 0.7125). (F) Measures of ONL thickness obtained from SD-OCT data in control and rho−/− mice (P21 and P180: p<0.0001). (G) Measures of ONL thickness obtained from morphometric measurements on cryostat sections in control and rho−/− mice (P15 and P180: p = 0.0022). Statistical significance of the difference between groups was analyzed at the initial time-point (P15 or P21) and the latest time-point (P180) studied by Student's T-test for E and F (n = 23 per group) and by Mann Whitney test for G (n = 6 per group). IPL: inner plexiform layer, INL: inner nuclear layer, ONL: outer nuclear layer, OLM: outer limiting membrane, RPE: retinal pigmented epithelium. SD: Standard Deviation. Scale bars: 50 µm.

