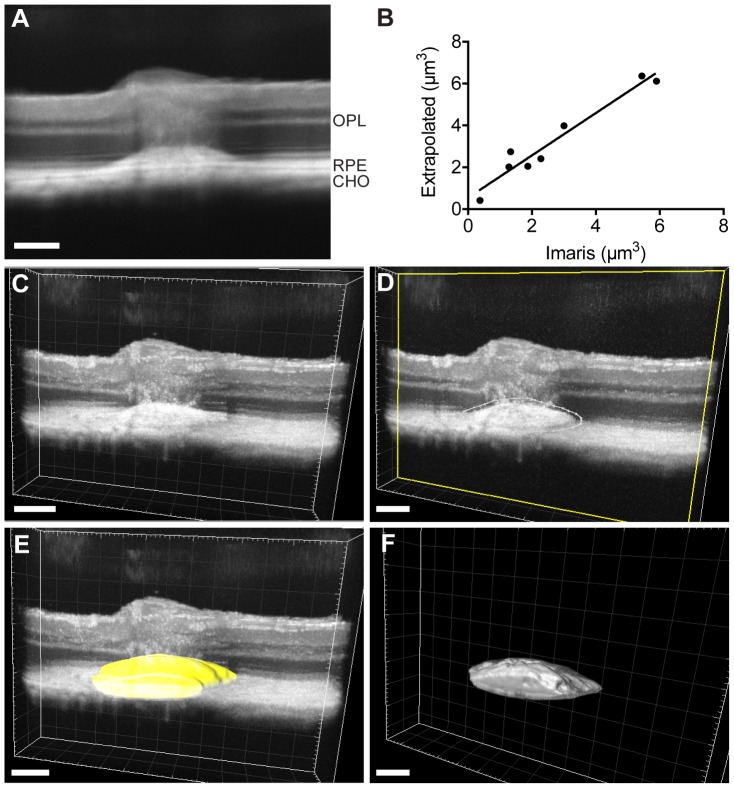
Figure 5. Quantification of laser-induced choroidal neovascularization (CNV) in C57BL6/JRj.
(A) Laser-induced CNV (Yag 532 Eyelite parameters: 100 µm, 50 ms, 400 mW) was visualized immediately after laser impact using SD-OCT imaging as described in the “materials and methods” section. Based on this image, a CNV volume is extrapolated using the following formula (4/3π*a*b2)/2, in which a is the polar radius and corresponds to the measure along the vertical axis and b is the equator radius and corresponds to the horizontal axis. (B) Linear regression showing that data obtained from extrapolation or Imaris 3D reconstruction (described step by step hereafter) are statistically equivalent (r2 = 0,94, n = 8). (C) Imaris software allows a 3D rendering of SD-OCT imaging. Data shown here arise from the same SD-OCT sequence than shown in panel A. (D) The neovascularization volume, just above the RPE cell layer, was delimitating manually (representative white dotted line in one slice) in about 20 slices (over 100) along z-axis to create a 3D mask. Based on this manual delimitation the Imaris software computed a 3D mask shown in yellow (E). The final visualization, that allowed CNV volume quantification, was obtained after automated mask thresholding (F). OPL: Outer Plexiform Layer, RPE: Retinal Pigmented Epithelium, CHO: Choroid. Scale bar: 50 µm.

