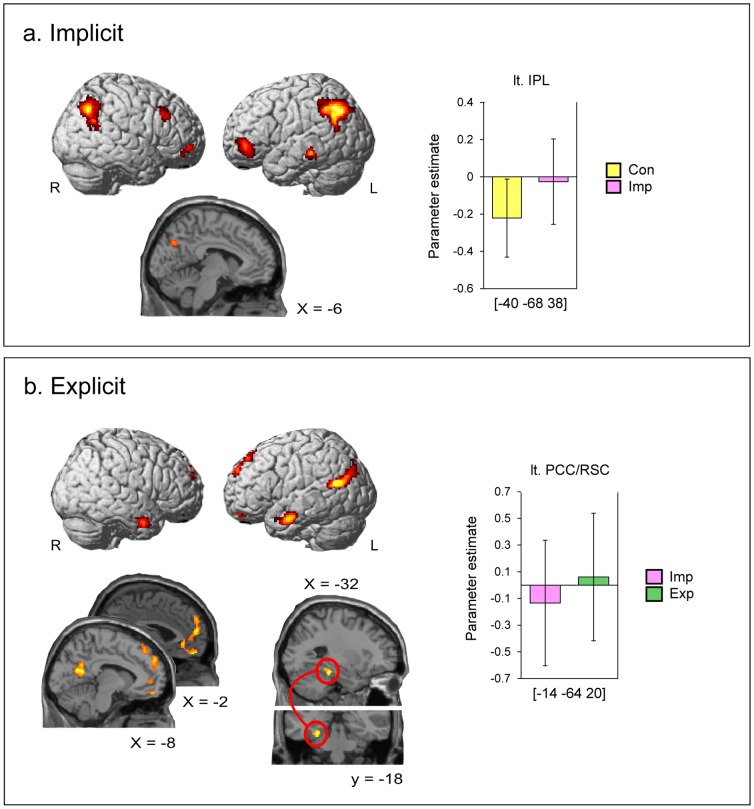
Figure 2. Activation areas specific to the implicit and explicit event simulation (ES) processes.
All voxels except for the regions described below are significant at a statistical threshold of p<0.001, corrected to p<0.05 for multiple comparisons using the cluster size, assuming the whole brain as the search volume. The result of the left parahippocampal cortex in the explicit ES process is thresholded at p<0.001 (uncorrected). Error bars indicate standard deviations (SDs). IPL: inferior parietal lobule. PCC: posterior cingulate cortex. RSC: retrosplenial cortex. R: right. L: left. The coordinates in the Montreal Neurological Institute (MNI) standard space are indicated.

