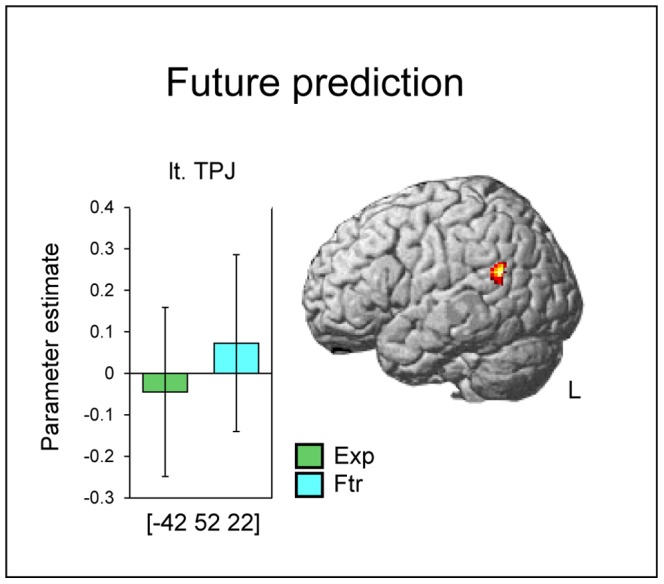
Figure 3. Activation areas specific to future prediction.

The result is thresholded at p<0.001, corrected to p<0.06 (k = 133) for multiple comparisons. Error bars indicate SD. TPJ: temporoparietal junction. R: right. L: left. The coordinates in the MNI standard space are indicated.
