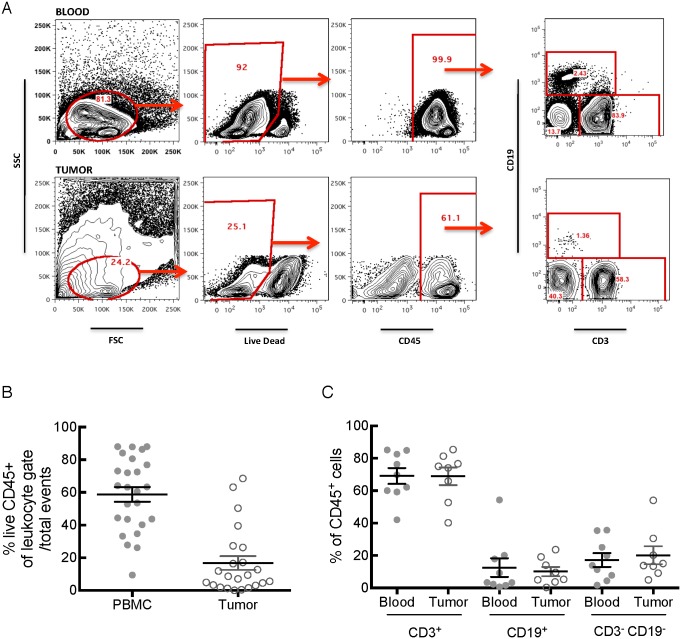
Figure 2. T cells dominate the intratumoral immune cell infiltrate.
A) Representative flow cytometry plots illustrating the typical gating strategy used to identify the viable immune cells in blood and tumor. B) The proportion of live CD45+ cells was calculated for each specimen. C) CD3+ T cells consistently comprised the majority of the viable immune cells in blood and tumor, while CD19+ B cells and non-T or B cells comprise smaller proportions.

