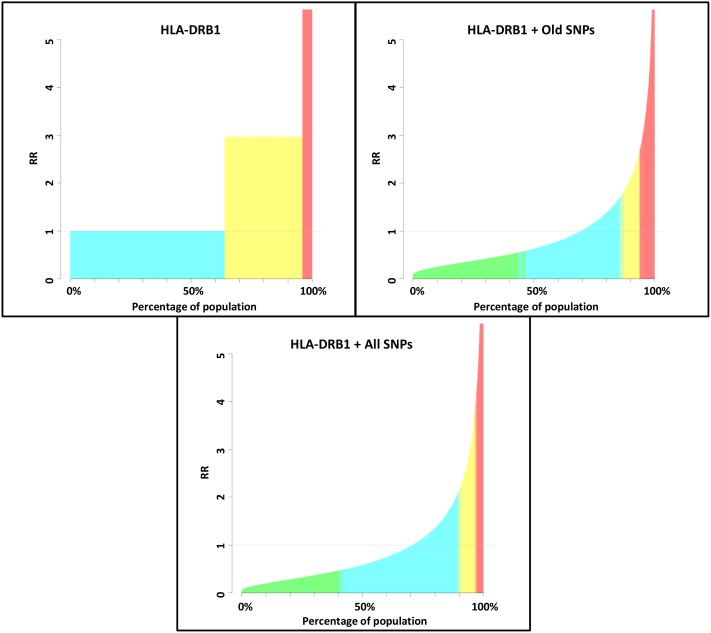
Figure 1. GWAS statistics (OR and risk allele frequencies) were used to simulate a population of 100,000 individuals under different models considering: only HLA-DRB1, HLA-DRB1 + MS associations known in 2011 and HLA-DRB1 + all currently known MS associations.
Categories of risk were defined based on the 95%CI of risk of each individual (see methods). Green = reduced risk, blue = average risk, yellow = elevated risk, red = high risk.

