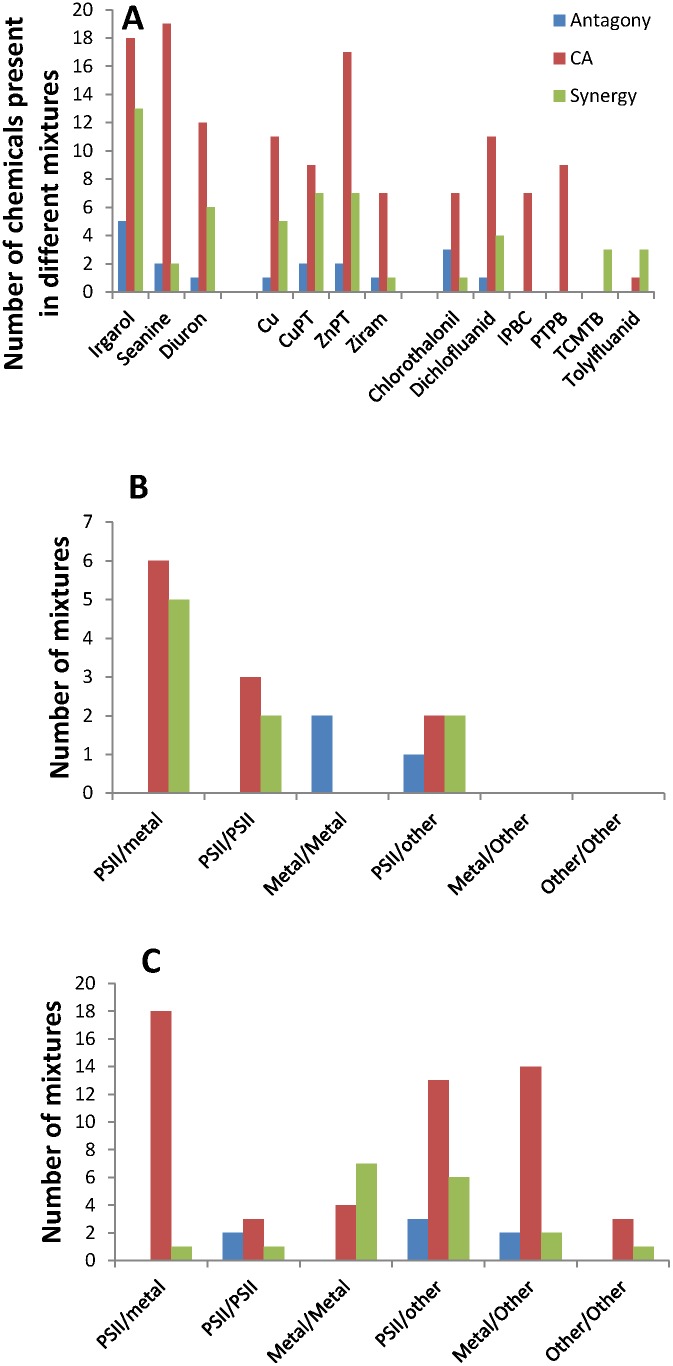
Figure 4. Frequency of antifoulant antagony, additivity and synergy.
Figure 3A shows the number of times each of the antifoulants occur in a binary mixture resulting in antagony (blue bars), concentration additivity (CA) (red bars) or synergy (green bars). Antifoulants occurring in less than 1% of the mixtures were excluded. In figure B and C, the number of binary combinations of photosystem II herbicides (PSII) metal ions or metal containing compounds (Metal) and other organic compounds (Other) resulting in either antagony, concentration additivity or synergy are shown for mixtures tested on B) auto-tropic organisms (plants and algae, n = 23) or C) heterotrophic organisms (microorganisms and animals, n = 80).

