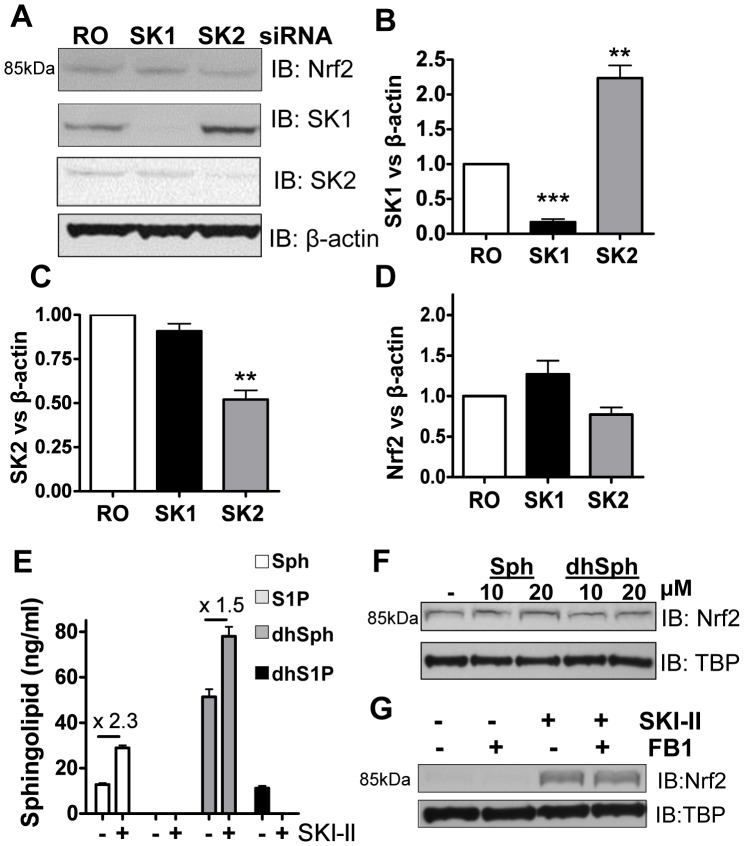
Figure 3. Effect of knocking-down SK1 and SK2 on Nrf2 expression in BEAS2B cells. A, B, C and D.
Cells transfected with random oligonucleotide (RO) control, SK1 or SK2 siRNA were analysed by immunoblotting (IB) for Nrf2, SK1, SK2, and normalized using β-actin (fold change vs. NT). *** p<0.0001, ** p<0.001, * p<0.05. E. BEAS2B cells were stimulated with SKI-II (1 µM) for 2 h, pellets were spiked with C17 sphingosine, dihydrosphyngosine, S1P and dihydroS1P and extracted sphingolipids (C18) determined by LC-MS/MS. Intensity peaks for Sphingosine (Sph), dihydrosphingosine (dhSph) and dyhydrosphingosine 1 phosphate (dhS1P) are indicated in the graph whereas sphingosine 1 phophate levels (S1P) were below the detection range. F. Nuclear extracts from cells treated with either sphingosine (10 and 20 µM) or dihydrosphingosine (10 and 20 µM) for 2 h were analysed by immunoblotting for Nrf2 expression and normalized using TBP (fold change vs. NT). G. Nuclear extracts from BEAS2B cells treated with fumonisin B1 (FB1; 2 µM) for 1 hour and SKI-II (0.5 µM) for 2 h were analysed by immunoblotting for Nrf2 and TBP expression. Results are representative of two or more independent experiments and are means and S.E. of triplicates.

