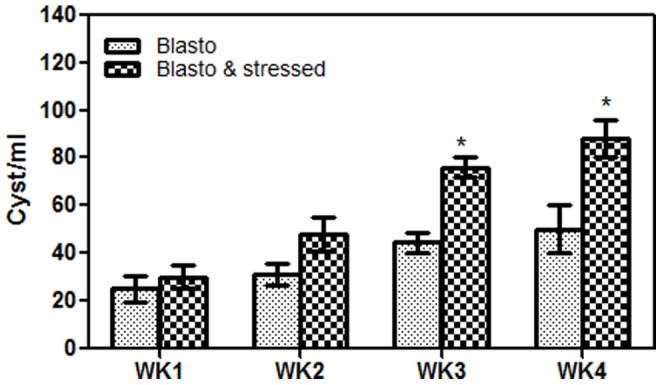
Figure 2. Cyst count in Blasto and Blasto-Stressed groups according to study duration.

Data shown is total number of cysts recovered from 3 stool pellets from each rat (n = 5). Results are expressed as mean ± SD. *P<0.05 is the comparison done against Blasto group.
