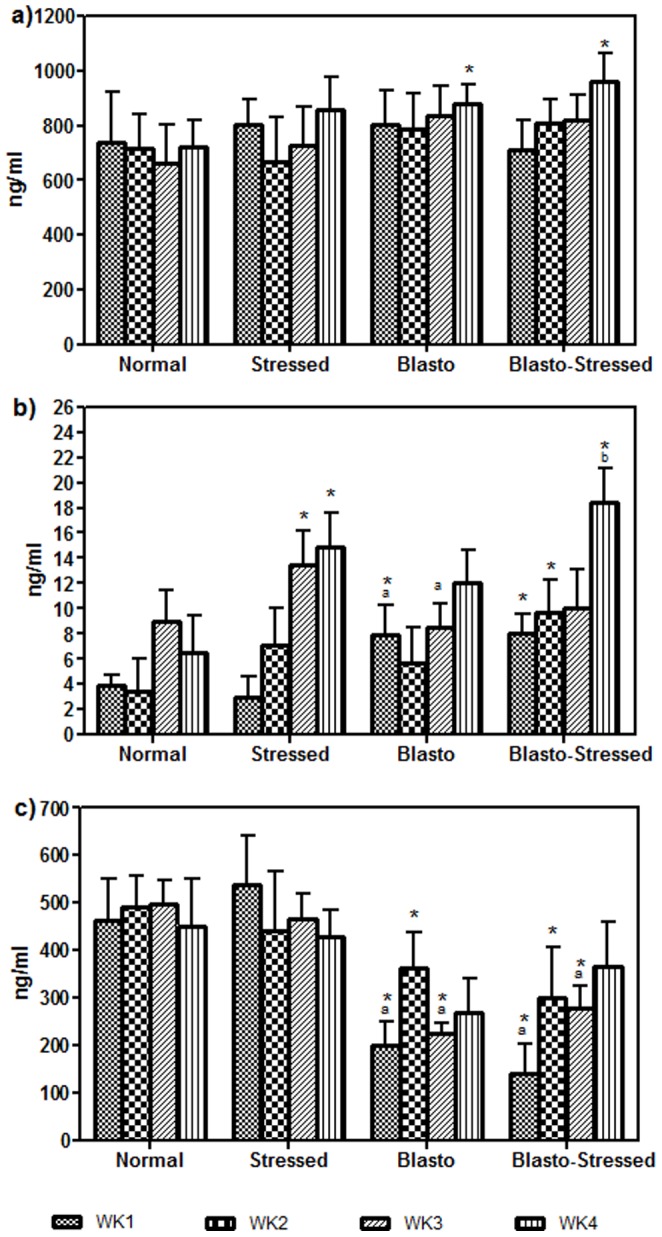
Figure 3. Levels of serum a) IgG, b) IgE, and c) IgM in the study groups according to study duration.

Data is given in mean ± SD. *P<0.05 is the comparison done against Normal group using Student's t-test. aP<0.05 is the significant comparison done against Stressed group using One-way ANOVA analysis.
