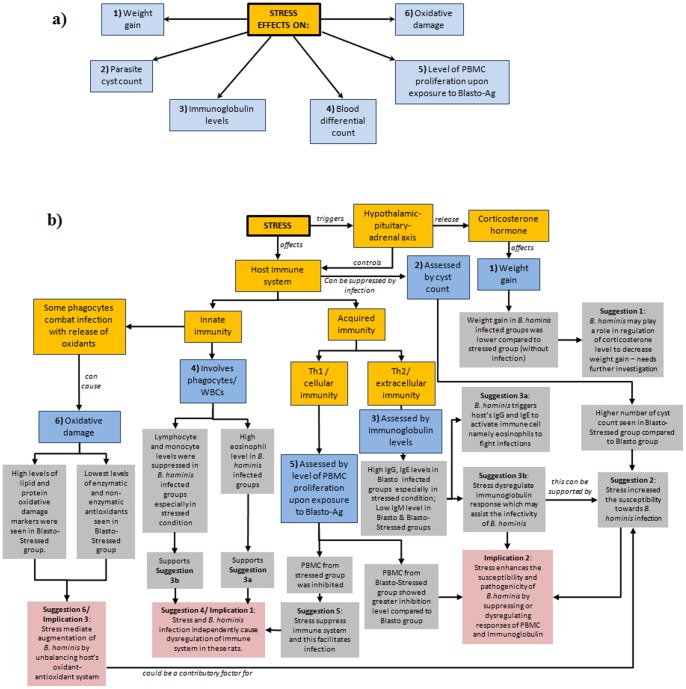
Figure 7. Illustration on the a) effects of stress on various parameters and b) overview of results obtained from this study.
Text box shaded in a) yellow represents general facts and hypothesis, b) blue represents the parameters used, c) grey represents observations obtained, and d) pink represents implications of the current study.

