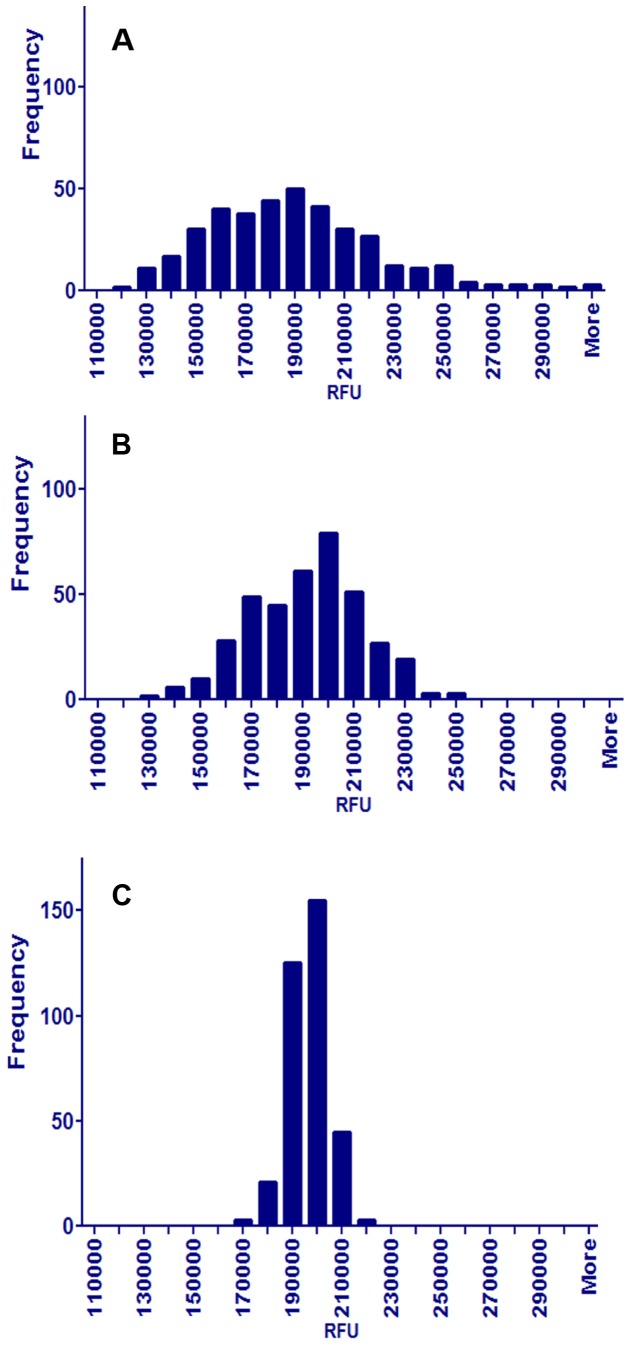
Figure 2. Histogram of unfiltered, vortexed and filtered M. smegmatis.
Distributions of resorufin fluorescence signals from 384 wells of a 384-well plate contained unfiltered (A), vortexed (B) or filtered (C) M. smegmatis. After the treatment, the bacteria were distributed into the 384-well plates followed by the addition of resazurin, which was converted to resorufin by the living bacteria.

