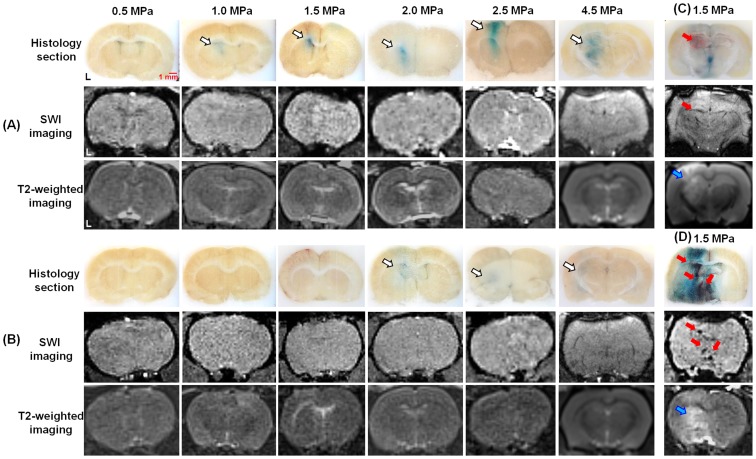
Figure 5. MRI results after FUS sonication.
A: In-house submicron bubbles with 10-MHz FUS sonication. B: SonoVue with 10-MHz FUS sonication. C: In-house submicron bubbles with 1-MHz FUS sonication. D: SonoVue with 1-MHz FUS sonication. (white arrows: the BBB-opening region; red arrows: areas of erythrocyte extravasations; blue arrows: brain edema).

