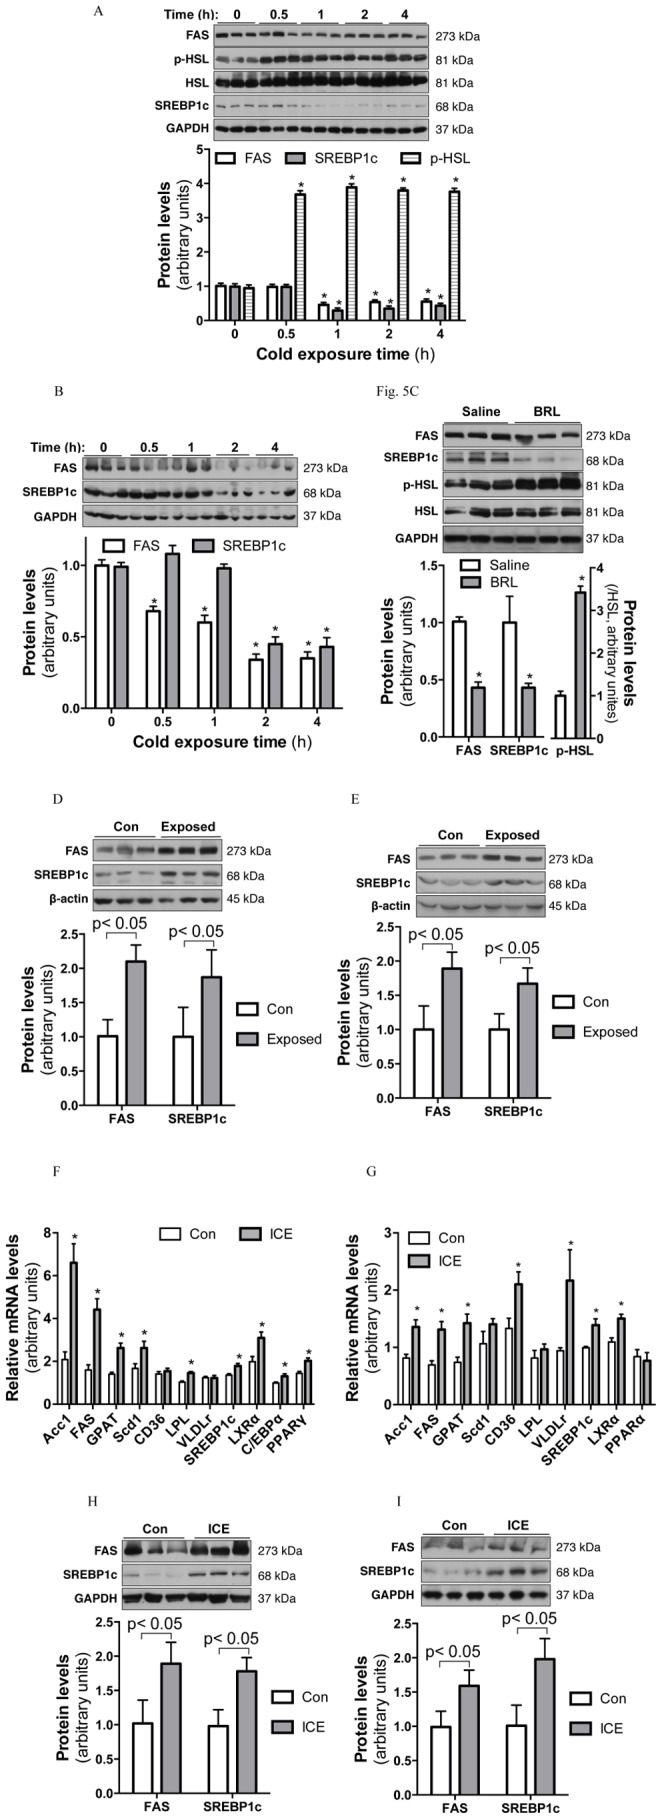
Figure 5. Effects of cold exposure on lipogenic gene expression in WAT and liver.

Tissue samples of epididymal fat (A&D) and liver (B&E) were collected during ACE (A&B) or 9 hours after room temperature recovery (D&E). (C) Epididymal fat samples were collected 2 h after BRL i.p. injection (0.2 ug/g body weight). Protein levels were determined by immunoblotting with the indicated antibodies. Levels of Phosphorylation of HSL were divided by total HSL protein and presented as fold increases over basal (A&C). Data presented are mean ±SEM, n = 4–6 mice per time point, *p<0.05 vs. time 0 or Saline controls. F–I, male mice were subjected to ICE for 12 days. Tissue samples of epididymal fat (F&H) and liver (G&I) were collected at 9 PM on day 12 at room temperature without fasting. mRNA (F&G) and protein (H&I) levels were determined by real-time PCR and Western blotting. Data presented are mean ±SEM, n = 8 per group, *p<0.05 vs. control mice.
