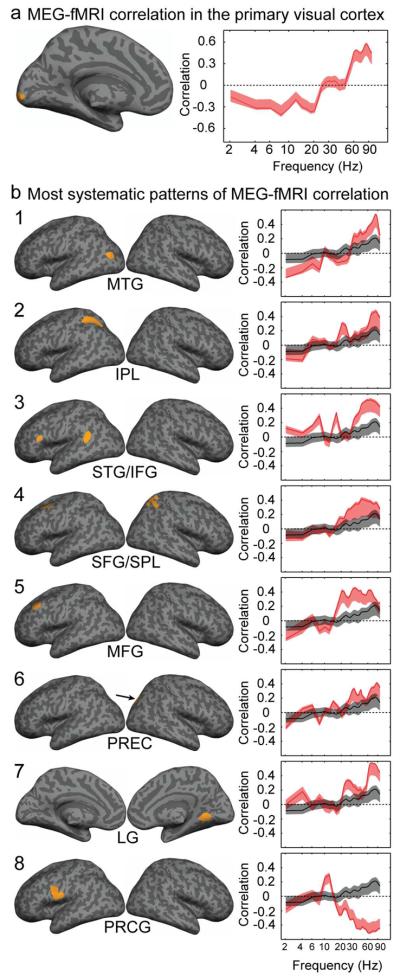
Figure 3.

Spatiospectral heterogeneity of the relationship between electrophysiological and hemodynamic responses. a) Medial view of a region in the left primary visual cortex showing significant MEG-fMRI correlation, and the mean correlation pattern (logarithmic scale) with 95% confidence limits for the two voxels that clustered together in the region. b) Components of significant MEG-fMRI correlation patterns that were detected for clusters of at least five voxels. Cortical areas and the mean spectral pattern (logarithmic scale) with 95% confidence limits of the correlation for each component (red line) (1, Middle Temporal Gyrus, MTG; 2, Inferior Parietal Lobule, IPL; 3, Superior Temporal Gyrus, STG, and Inferior Frontal Gyrus, IFG; 4, Superior Frontal Gyrus, SFG, and Superior Parietal Lobule, SPL; 5, Middle Frontal Gyrus, MFG; 6, Precuneus, PREC; 7, Lingual Gyrus, LG; 8, Precentral Gyrus, PRCG). The black line represents the average correlation pattern across all voxels that showed significant MEG-fMRI correlation, with the grey sidebands indicating the 95% confidence limits. Most of these components map to a single contiguous cluster of voxels within a single cortical area, with the exception of components 3 and 4 which map to multiple contiguous cortical regions. The Talairach coordinates of the components are given in Table 2.
