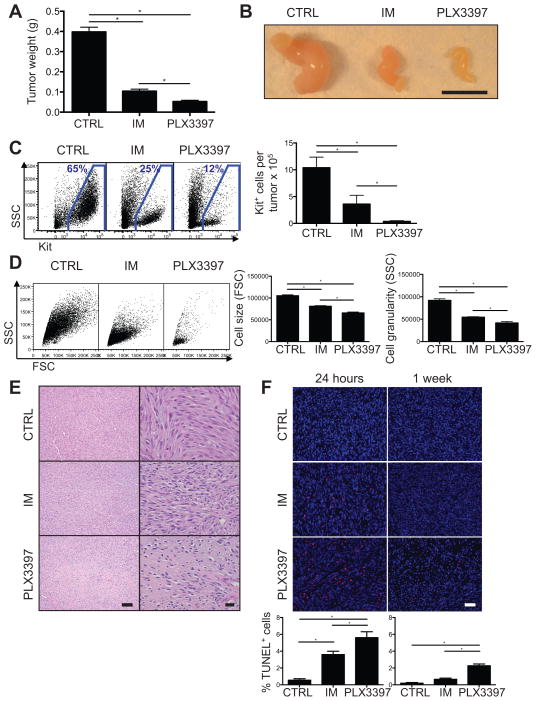
Figure 1. PLX3397 is superior to imatinib in KitV558del/+ mice.
(A–E) Tumors from KitV558del/+ mice were analyzed following 4 weeks of treatment with regular drinking water and control chow (CTRL), imatinib in the drinking water and control chow (IM), or regular drinking water and PLX3397 chow (PLX3397). (A) Tumor weight. (B) Gross tumor appearance. Scale bar, 1 cm. (C–D) Tumors were digested with collagenase, and Kit+ tumor cells were analyzed by flow cytometry. (C) Representative plots demonstrate Kit+ tumor cells gated on CD45− cells (left). CD45−Kit+ cells quantified per tumor based on trypan blue exclusion and flow cytometry (right). (D) Representative plots gated on Kit+ cells demonstrate forward and side scatter of light (FSC, SSC), which indicate cell size and granularity. (E) Tumor H&E staining. Scale bars, 100 (left) and 20 μm (right). (F) TUNEL staining of tumors from KitV558del/+ mice treated for either 24 hours or 1 week. Scale bar, 40 μm. TUNEL+ cells, quantified as a percentage of total cells per high power field (below). Data in A, C are pooled from 4 experiments and in D–F are representative of 1–3 experiments, each with 2–6 mice per group. Bars show mean +/− SEM. *p<0.05.

