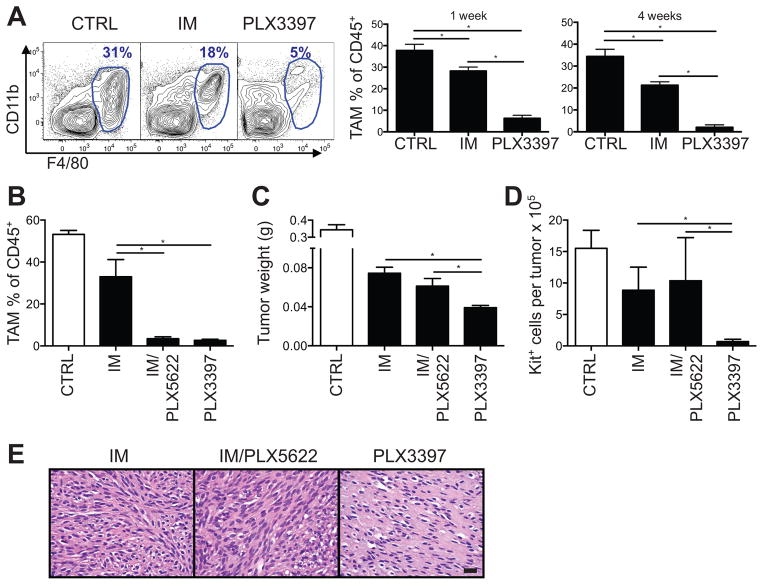
Figure 2. CSF1R inhibition does not account for PLX3397 effects.
KitV558del/+ mice were treated for 4 weeks unless otherwise indicated. (A) Tumor-associated macrophages (TAMs, F4/80hi) were measured by flow cytometry, with representative flow plots gated on CD45+ cells. (B) Tumor-associated macrophage depletion is shown as a percentage of CD45+ cells measured by flow cytometry. (C) Tumor weight. (D) Tumor Kit+ cell number, measured by trypan blue exclusion and flow cytometry. (E) Tumor H&E staining. Scale bar, 20 μm. Data in A, B, E are representative of 2–5 experiments and in C–D are pooled from 2 experiments, each with 2–5 mice per group. Bars show mean +/− SEM. *p<0.05.

