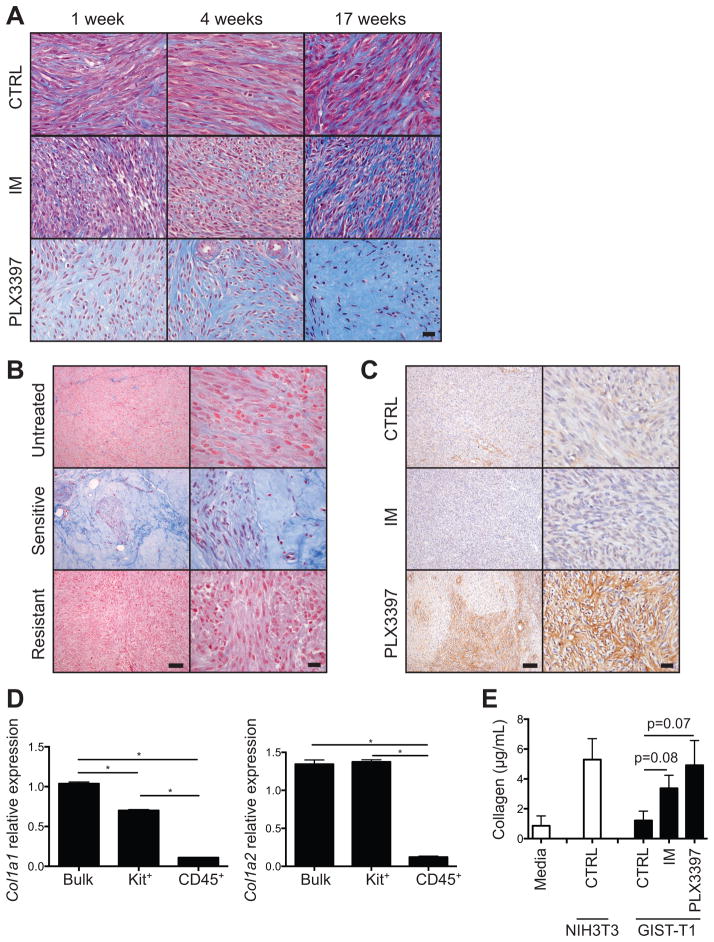
Figure 5. KIT inhibition induces tumor fibrosis proportional to magnitude of KIT inhibition.
(A) Masson’s trichrome staining of tumors from KitV558del/+ mice. Scale bar, 20 μm. (B) Masson’s trichrome staining of human GIST specimens representative of 8 of 9 untreated, 5 of 6 imatinib-sensitive, and 2 of 2 imatinib-resistant patients. Scale bars, 100 (left) and 20 μm (right). (C) Type I collagen staining of tumors from KitV558del/+ mice treated for 4 weeks. Scale bars, 100 (left) and 20 μm (right). (D) Col1a1 and Col1a2 expression as measured by RT-PCR in bulk tumor, Kit+ tumor cells, or CD45+ stromal cells isolated by magnetic bead separation from tumors of KitV558del/+ mice treated with PLX3397 for 5 days. (E) Soluble collagen in conditioned media from GIST-T1 cells cultured for 48 hours as indicated. Mean of 5 replicates is shown. Collagen from cultured NIH3T3 fibroblasts is shown for comparison. The lower limit of detection was 3.5 μg/mL. Data are representative of 1–3 experiments, each with 2–8 per group. Bars show mean +/− SEM. *p<0.05.

