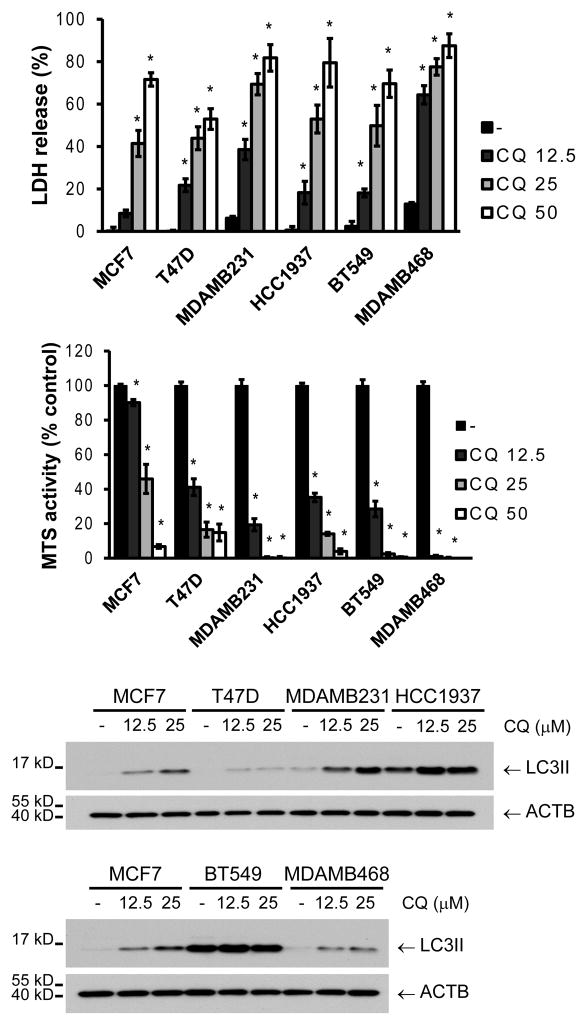
Figure 4. Breast cancer cell lines have a differential sensitivity to pharmacological inhibition of autophagy.
Cells were treated with different concentrations of chloroquine (CQ, μM) and evaluated for death/survival by LDH release or MTS reagent after 48 h of treatment (A). LC3II accumulation was evaluated after a 4 h CQ treatment in all cell lines (B). MCF7 cells were included in both gels for comparison. Graphs show mean ± SE of three independent experiments performed in triplicate. * = different from its respective untreated control (p < 0.05).

