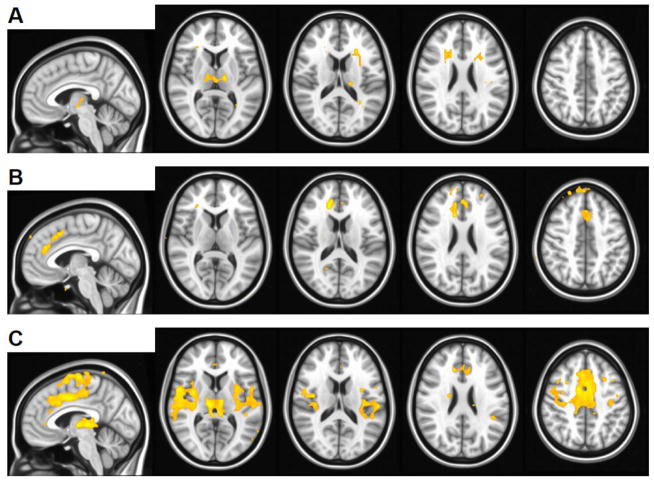
Figure 1.
Some GGE patients exhibit predominantly thalamic (A) or cortical (B) GSWD-related fMRI activation. A mixture of both thalamic and cortical activation (C) is the most commonly observed pattern. Activation (orange) for three representative subjects is overlaid on the MNI152 standard brain in radiological orientation with slice coordinates shown at bottom. Voxels with t > 3.5 (uncorrected p < 0.001) are shown. GSWD-related deactivation pattern is not shown. Pictures are in radiological convention (left on the picture is right in the brain).

