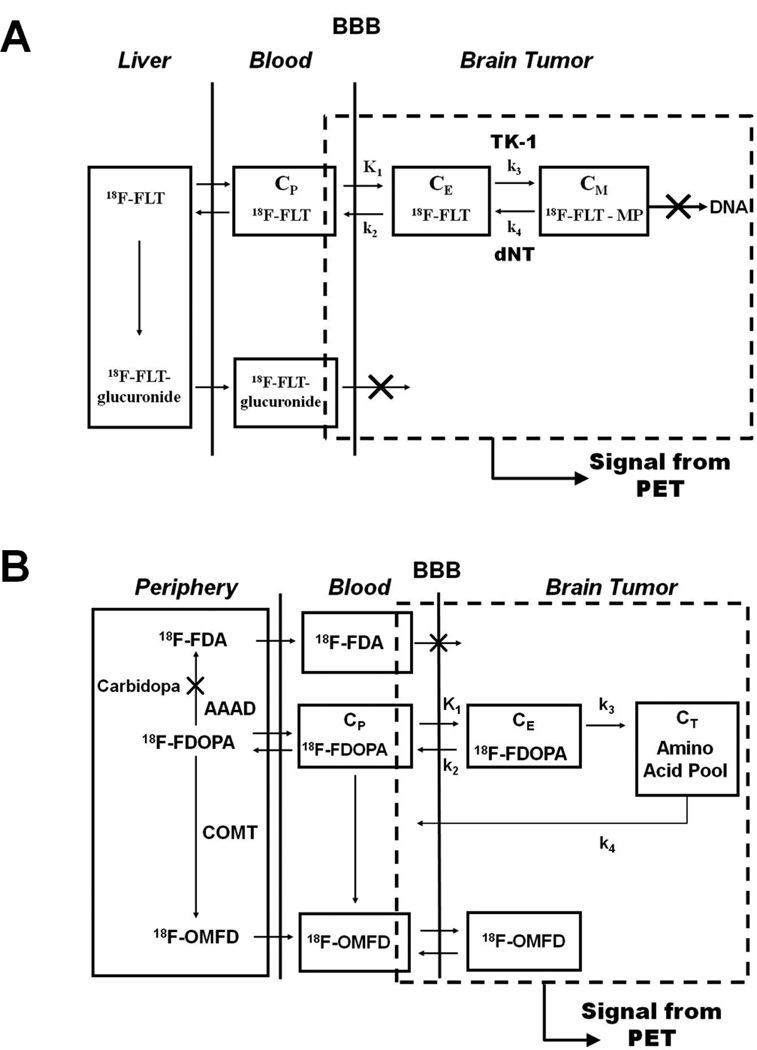
Figure 2.
(A) Tracer kinetic model for FLT in brain tumors. The catenary model consists of a vascular compartment and two tissue compartments, each of which represents FLT in one of two different chemical states. Intracellular radioactivity accumulation results from the formation of phosphorylated FLT nucleotides in competition with nucleotidase-mediated dephosphorylation and FLT efflux [42]. K1 is the transport rate constant of FLT from blood (or plasma) into the tumor cell via nucleoside-facilitated transporters, k2 is the loss or leak from the system, k3 is the rate constant for kinase-modulated phosphorylation of FLT, and k4 is the rate constant that describes the dephosphorylation of FLT-monophosphate by phosphatases [such as 5′ (3′)-deoxyribonucleotidase 1 (dNT1)] [42]. (B) Tracer kinetic model for FDOPA in brain tumors. FDOPA is transported across tumor cell membranes by L-amino acid transporters, which are overexpressed in most gliomas [38]. Increased transport of amino acids is most likely a result of increased demand for amino acids. The parameter k3 is the sequestration rate constant which describes the transfer of FDOPA into the amino acid pool of the tumor, which is larger in tumors than in normal brain tissue (e.g., cerebral cortex and cerebellum). Huang et al. was the first to estimate FDOPA kinetics in the brains of normal human subjects [44]. Schiepers et al. was the first to report FDOPA kinetics in human brain tumors [45].

