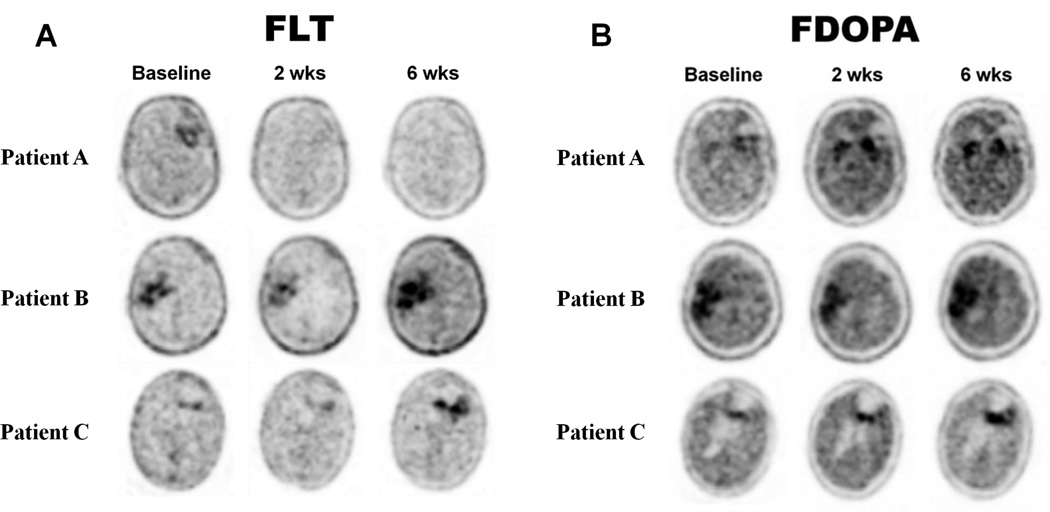
Figure 4.
(A) FLT PET images at baseline and after 2 and 6 weeks from the start of treatment as shown for a long-term survivor (Patient A, top row) and two short-term survivors (Patients B and C, middle and bottom rows). Images are displayed in radiological view, where the right side of the subject’s brain is on the left side of the image and vice versa. (B) FDOPA PET images at baseline and after 2 and 6 weeks from the start of treatment as shown for a long-term survivor (Patient A, top row) and two short-term survivors (Patients B and C, middle and bottom rows). Note that Patient A has a tumor near the left striatum. Patients A, B, and C are Patients 20, 4, and 2 in Table 1, respectively.

