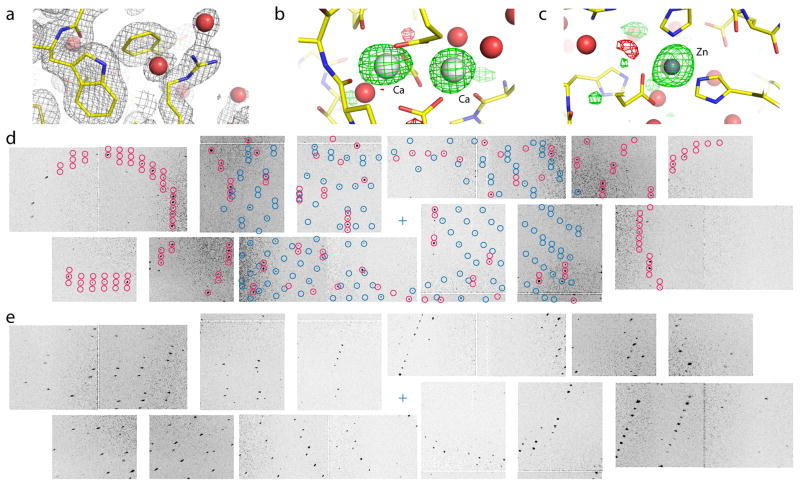
Figure 1. Thermolysin structure determination at 2.1 Å resolution.
(a) 2mFo−DFc electron density contoured at 1 σ (gray mesh) with water molecules shown as red spheres. (b) mFo−DFc difference density map contoured at +3 σ (green mesh) and −3 σ (red mesh) showing binding sites for two of the four Ca ions and (c) the single Zn ion. (d) Detail of two crystal lattices found on the same diffraction image. Modeled spot positions assigned to the different lattices are shown in red and blue, respectively. The sample-detector distance of 135 mm corresponds to a resolution of 2.15 Å at the edges. (e) Detail from a different diffraction image. Increasing radial spot elongation is observed with distance from the beam center (blue cross).

