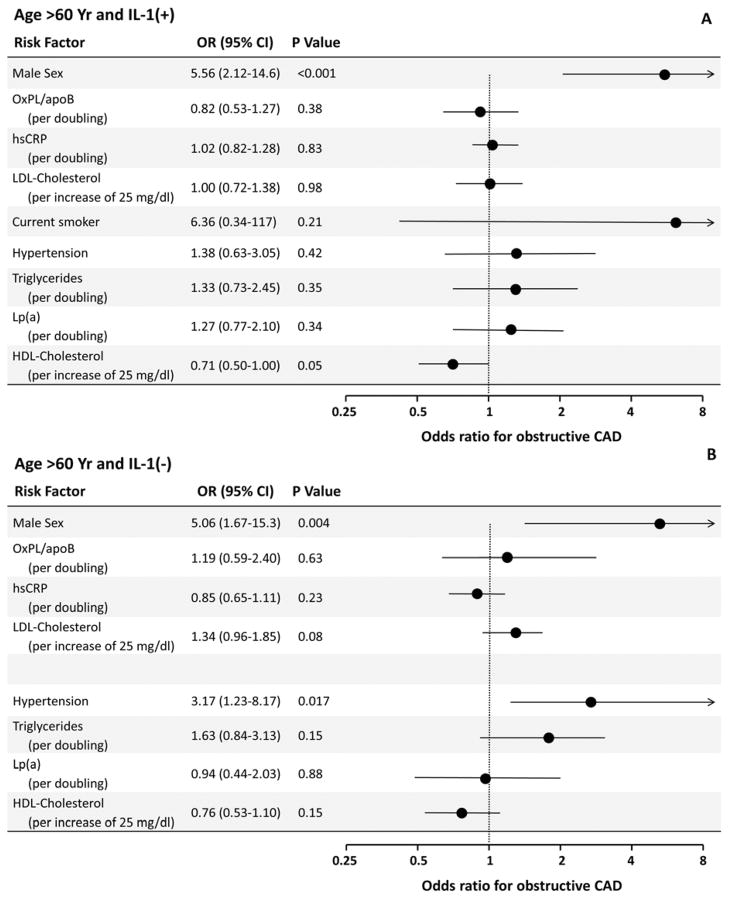
Figure 3. Odds ratios (OR) (solid line) and 95% confidence intervals (dashed lines) for CAD were calculated in a logistic regression model.
In this model, risk associated with an incremental increase of each risk factor ranging from 0 (i.e., an odds ratio of 1) to the value equal to the difference between the 75th and 25th percentiles of the risk factors. The analysis was performed on patients ≤60 years of age stratified as IL-1(+) or IL-1(−).

