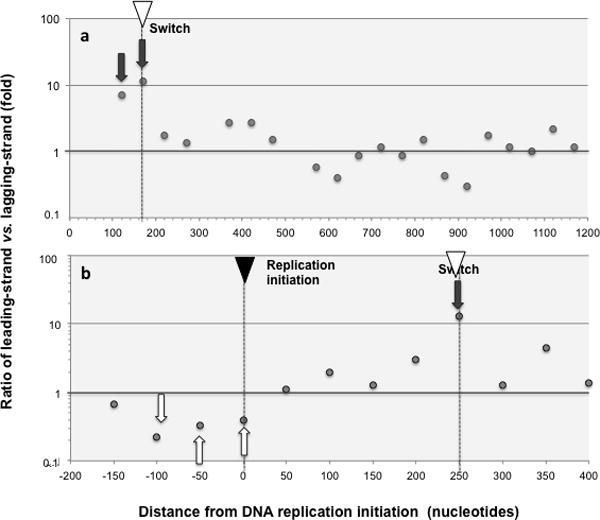
Fig. 2. Ratio of leading-strand vs. lagging-strand marker mutations.

Ratios of marker leading- versus lagging-strand mutations (as defined in Methods) are shown for 50 nucleotide intervals at increasing distance from replication initiation. Only intervals with at least 10 mutations are shown and hotspots, defined as areas with 5 or more mutations in the same or contiguous positions (Methods) were removed. On the X-axis the number means the end of the interval, so “50” means 0–50 sequence interval, and “− 200” means −250 to −200 sequence interval. The location of DNA replication initiation and switch are indicated with a black and a white inverted triangle, respectively. Areas of high bias for leading-strand replication are highlighted with dark grey arrows, and high bias for lagging-strand replication with white arrows. Mutation hotspots and OPS were removed prior to the analysis (Methods) a. GFP libraries. Both liquid and solid plate libraries are included. The following 3 (out of 21) intervals comprised fewer than 10 mutations and were excluded from the analysis as unrepresentative: 470–520, 1170–1220 and 1220–1270. b ALKBH1 library.
