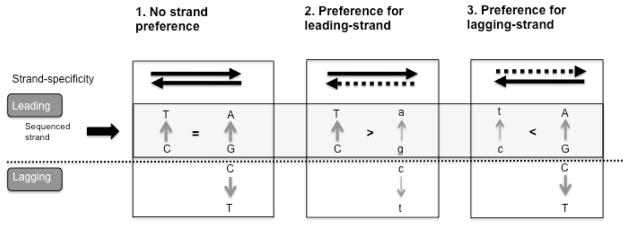
Fig. 3. Rationale for determining strand specificity based on frequency of complementary mutations.

C→ T is shown as an example. If the error rate of the polymerase for C→ T ⋙ G→ A, leading-strand mutations appear as C→ T and lagging-strand mutations as G→ A. The frequency of complementary strand mutations is indicative of the strand preference of the polymerase: individual C→ T mutations approximating leading-strand replication, and individual G→ A mutations approximating lagging-strand replication. This is in contrast to the scenario where C→ T >G→ A, in which case C→ T is only more likely to be leading-strand but not an unambiguous marker of strandedness, since it can also correspond to a G to A in the lagging strand. In either case the ratio of C→ T vs. G→ A can be used then to establish the strand preference of the polymerase. Three scenarios are shown: 1) no strand preference; 2) preference for leading-strand; 3) preference for lagging-strand. Both strands are shown, and the light grey box highlights the leading (sequenced) strand. Dashed lines represent decreased replication preference. Mutations introduced during replication of the non-preferred strand are denoted in small letters.
