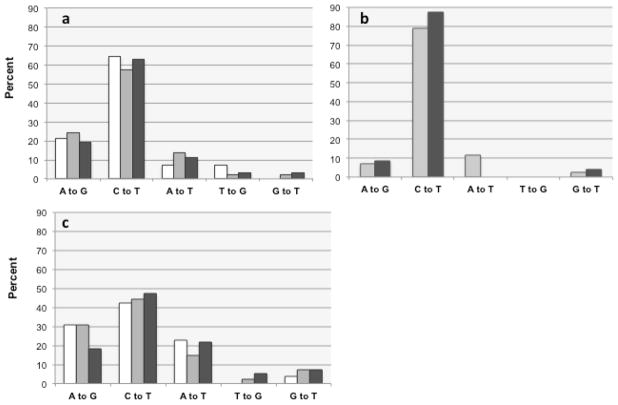
Fig. 5. Concordance between mutation spectra.
The relative proportion of indicator leading-strand mutations inferred from our analysis is shown, in percentage, as derived from leading-strand sequence before functional replisome assembly at position 170 (white columns), from leading-strand sequence after assembly (light grey columns), and for lagging- strand sequence (dark grey) a. Plate mutagenesis protocol, excluding hotspots and OPS; n=17 (<170), n=155 (>170 leading), n=62 (>170 lagging). b Plate mutagenesis protocol, hotspots only, excluding OPS; n=69 (>170 leading), 25 (>170 lagging). c. Suspension culture mutagenesis protocol, excluding hotspots and OPS; n=26 (<170), 139 (>170 leading), 55 (>170 lagging).

