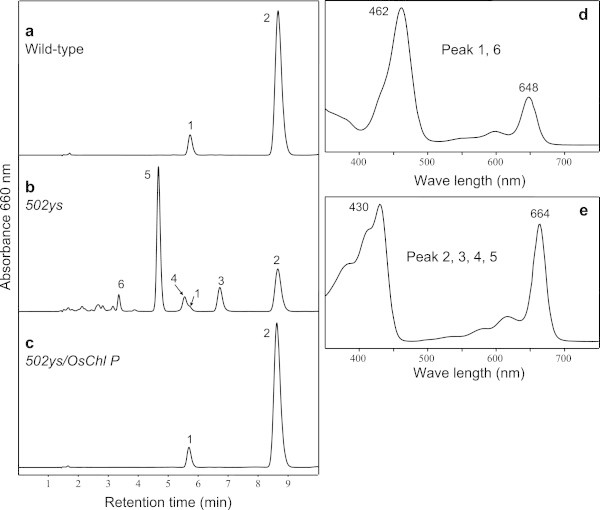
Figure 5.

HPLC analysis of Chls. The elution profiles of wild type (a), 502ys mutant (b) and 502ys/OsCHL P transgenic line (c) were detected at 660 nm. Peak 1, Chl b; peak 2, Chl a; peak 3, 4 and 5, ChlTHGG a, ChlDHGG a and ChlGG a, respectively; peak 6, ChlGG b. The absorption spectra of the peaks 1 and 6 (d) and the peaks 2, 3, 4 and 5 (e) in acetone were compared, respectively.
