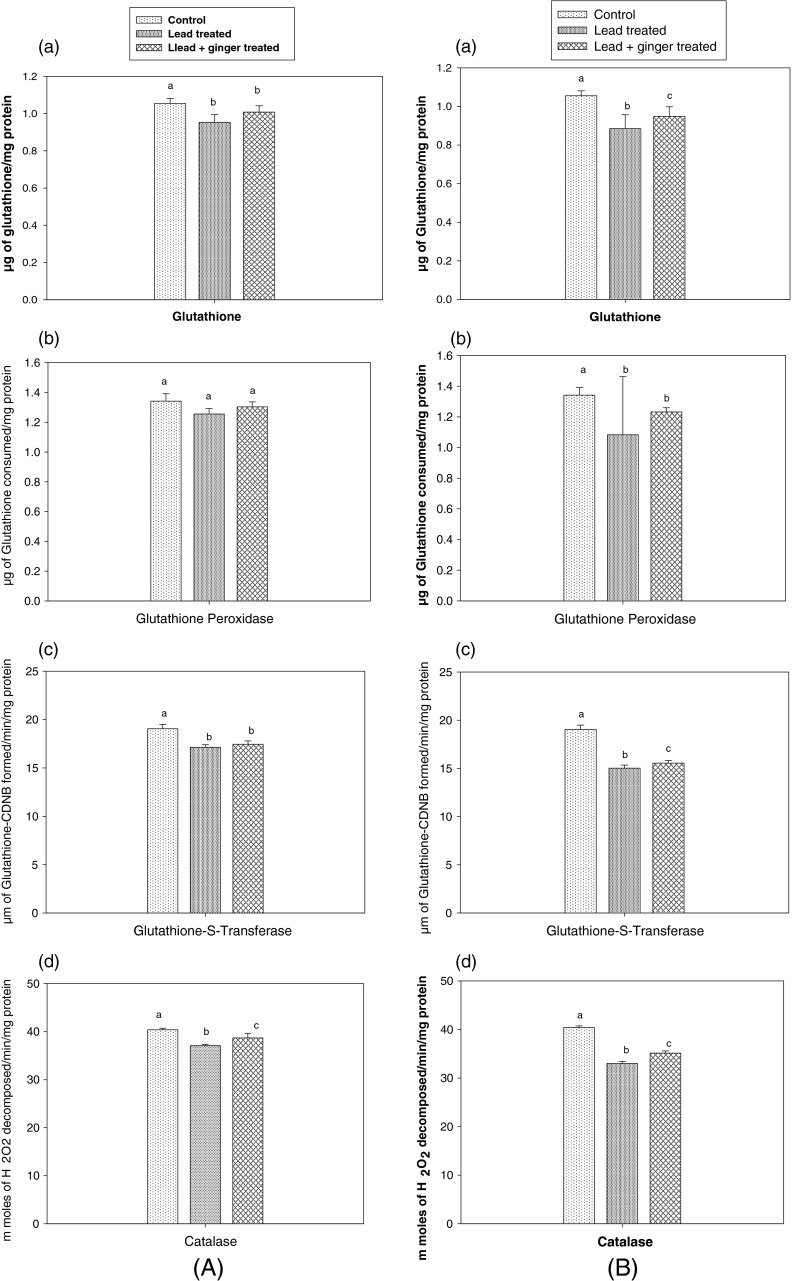
Fig. 1.
Comparison of (a) Glutathione level, (b) Glutathione peroxidase, (c) Glutathione-s-transferase, (d) Catalase enzymes in control group for (A) 1 week lead treated group and 1 week lead plus ginger treated group and (B) 3 weeks lead treated group and 3 weeks lead plus ginger treated group (n = 3). Different letters on the bars represent significantly different at P < 0.05. Same letters on the bars are not significantly different. The results are presented as mean ± SD of three determinations

