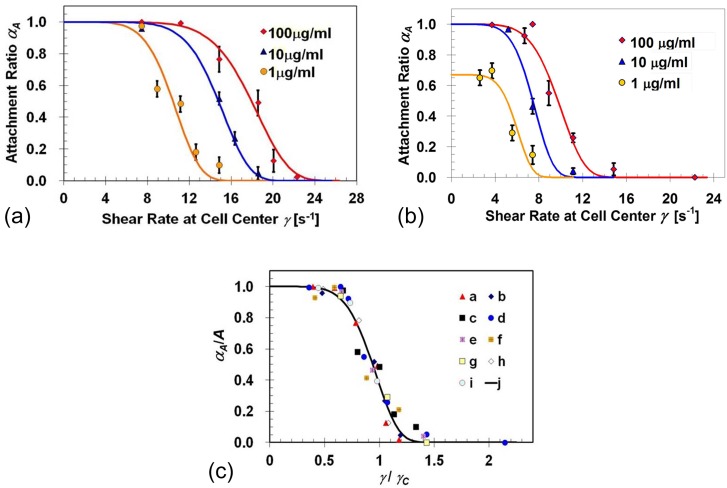
Figure 2.
Attachment-ratio measurements (symbols) as a function of the applied flow shear rate for: (a) BT-20 and (b) MDA-MB-231 cell lines in microchannels functionalized with EpCAM antibodies at three solution concentrations of 1, 10, and 100 μg/ml; the solid curves are best fits to the experimental-data sets calculated based on Eq. 2; (c) a summary of measured and computed cell-attachment ratio dependence on the applied shear rate: experimental data sets “a,” “b,” and “c” are for BT-20 cells, while “d,” “e,” and “f” are for MDA-MB-231 cells, both in microchannels functionalized with anti-EpCAM solution concentrations of 1, 10, and 100 μg/ml, respectively; computed data sets “g,” “h,” and “i” are for NR = 1.35 × 10⁸/cm2 and NL = 6.35 × 10⁷/cm2, NR = 1.35 × 10⁸/cm2 and NL = 4.0 × 10¹⁰/cm2, and NR = 1.11 × 10¹⁰/cm2 and NL = 4.0 × 10¹⁰/cm2, respectively; curve “j” is calculated using Eq. 2 with exponents B = 6.

