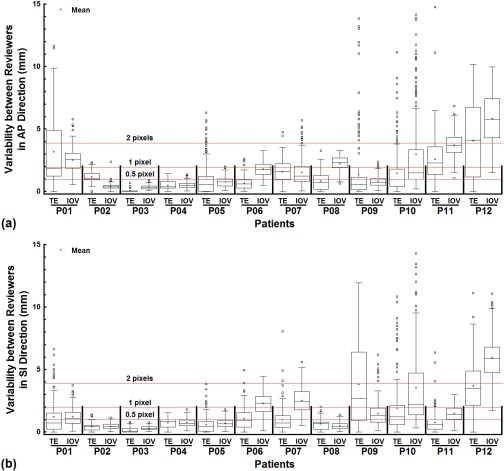
Figure 3.
The tracking error (TE) was compared to the interoperator variability (IOV) with Box-and-Whisker plots for all patients in the AP (a) and SI (b) directions, respectively. The mean value for each quantity for each patient was superimposed on the box plots. The lines marking the 0.5, 1, and 2 pixels positions were provided to facilitate comparisons.

