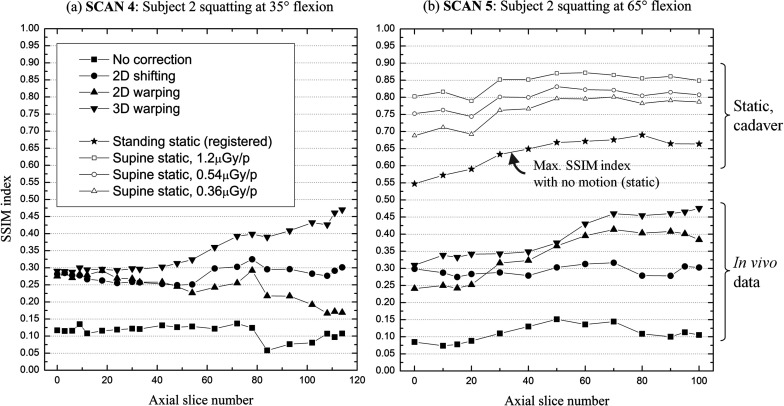
Figure 10.
A comparison of image quality improvement between axial slice images before and after applying the three different motion correction methods. (a) and (b) show SSIM indices as a function of the axial slice number for the two data sets that demonstrate the largest motion. The axial slice with the lowest slice number (0) on the X-axis is around the bottom of the femur and close to the central slice out of 512 slices. The highest slice number corresponds to the slice around the upper boundary of the reconstructed volume. The plot with a solid star-shaped symbol in (b) shows image quality of the static cadaver tibia after applying the same segmentation and registration as was done for in vivo data. (b) also shows the sensitivity of the SSIM to detector dose requests (1.2 μGy, 0.54 μGy, and 0.36 μGy per projection).

