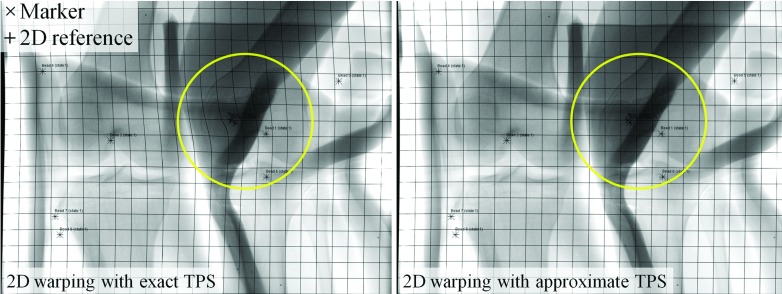
Figure 4.
A projection was warped in 2D using TPS mappings. The markers (×) were mapped smoothly onto the 2D references (+). The left and right show the warped projection with exact TPS fitting (λ = 0) and with approximate TPS fitting (λ > 0). The grid lines were inserted to improve visualization of the overall warping of the projection.

