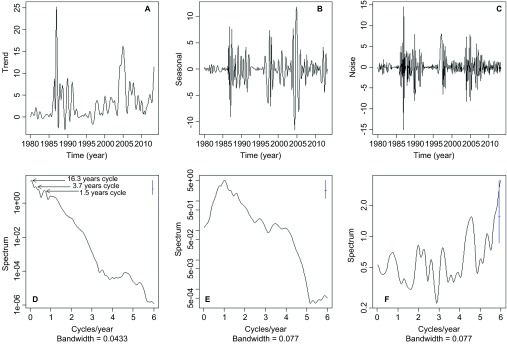
Figure 5.

Malaria incidence (per 1000 people) EMD and spectral analysis of IMFs. (A) Residue; (B) first IMF; (C) second IMF. Periodograms for (D) EMD residue, which shows most of the power at inter-annual time scales, i.e., less than one cycle per year; (E) first IMF, which has the highest power at a seasonal time scale, i.e., one cycle per year; and (F) second IMF, which has high variability across the spectra and therefore can be considered as white noise. In D–F, the blue lines are the confidence intervals for the power spectra.
