
Figure 5.
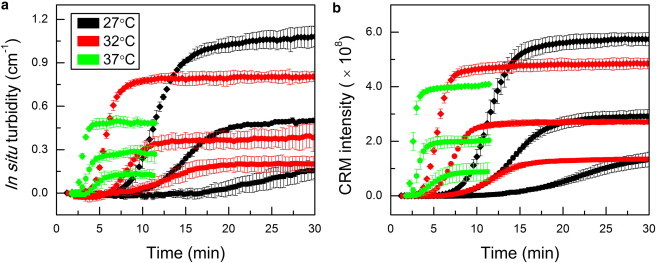
Average (a) IST and (b) CRM curves for 0.5 mg/ml (squares), 1.0 mg/ml (circles), and 2.0 mg/ml (diamonds) collagen solutions gelled at 27°C (black), 32°C (red), and 37°C (green). Every other point is shown for clarity. Error bars represent standard deviations. To see this figure in color, go online.