
Figure 7.
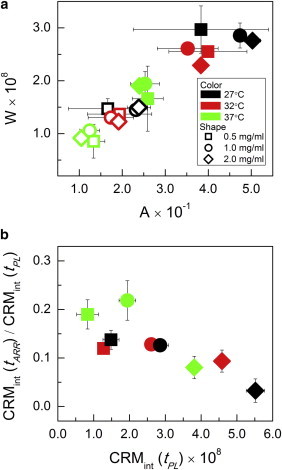
(a) The ratio of CRM intensity to concentration (W = CRMint/c) versus that of IST to concentration (A = IST/c) at tINF (open symbols) and tPL (solid symbols). Time points evaluated were determined from the CRM intensity curve for W and the IST curve for A. (b) Ratio of CRM intensity at tARR to that at tPL versus CRM intensity at tPL. Symbols and colors are as shown in (a). Error bars indicate standard deviations and are shown only when larger than the symbols. To see this figure in color, go online.